OPEN-SOURCE SCRIPT
CVD Candles.
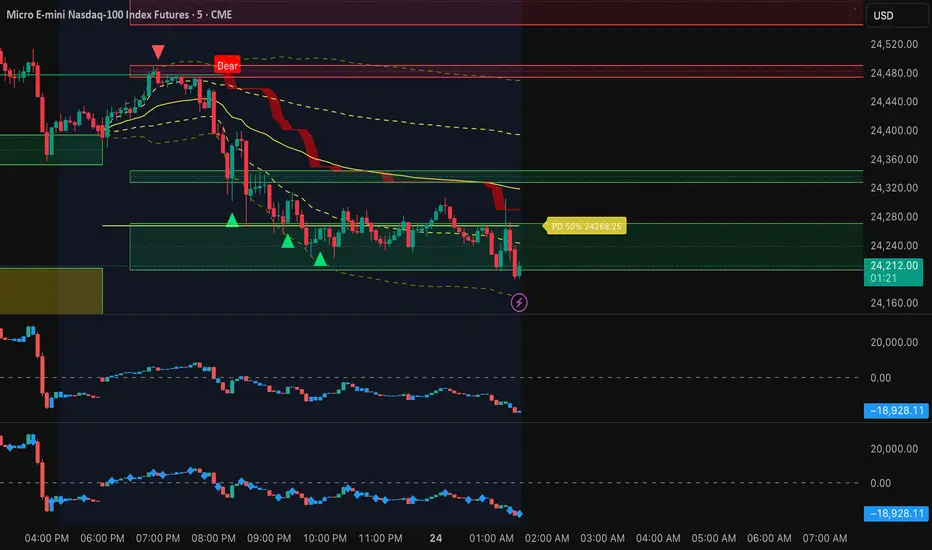
█ WHAT IS CVD?
Cumulative Volume Delta (CVD) tracks the running total of buying volume minus selling volume. It reveals who's in control — buyers or sellers — beyond what price alone shows.
█ HOW IT WORKS
Each candle represents the cumulative delta:
• Delta = Buy Volume − Sell Volume
• CVD = Running sum of delta
This creates a "price chart" of order flow, making it easy to spot divergences between price and actual buying/selling pressure.
█ 3-COLOR SYSTEM
🟢 GREEN — Strong Bullish
Price closed above previous bar's high. Buyers in control.
🔴 RED — Strong Bearish
Price closed below previous bar's low. Sellers in control.
🔵 BLUE — Neutral (Reversal Signal)
Price closed between previous high/low. Momentum pausing — watch for potential reversal.
█ HOW TO USE
1. TREND CONFIRMATION
Price up + CVD up (green) = Strong trend ✓
Price up + CVD down (red) = Weak trend, possible reversal
2. DIVERGENCE
Price making new highs but CVD declining = Bearish divergence
Price making new lows but CVD rising = Bullish divergence
3. REVERSAL SIGNALS
Blue candles indicate momentum pause — often precede reversals
█ SETTINGS
• Reset Daily: Resets CVD at each session start
• Works best on futures, stocks, and crypto with volume data
█ CREDITS
Inspired by Bookmap's Cumulative Delta indicator.
Cumulative Volume Delta (CVD) tracks the running total of buying volume minus selling volume. It reveals who's in control — buyers or sellers — beyond what price alone shows.
█ HOW IT WORKS
Each candle represents the cumulative delta:
• Delta = Buy Volume − Sell Volume
• CVD = Running sum of delta
This creates a "price chart" of order flow, making it easy to spot divergences between price and actual buying/selling pressure.
█ 3-COLOR SYSTEM
🟢 GREEN — Strong Bullish
Price closed above previous bar's high. Buyers in control.
🔴 RED — Strong Bearish
Price closed below previous bar's low. Sellers in control.
🔵 BLUE — Neutral (Reversal Signal)
Price closed between previous high/low. Momentum pausing — watch for potential reversal.
█ HOW TO USE
1. TREND CONFIRMATION
Price up + CVD up (green) = Strong trend ✓
Price up + CVD down (red) = Weak trend, possible reversal
2. DIVERGENCE
Price making new highs but CVD declining = Bearish divergence
Price making new lows but CVD rising = Bullish divergence
3. REVERSAL SIGNALS
Blue candles indicate momentum pause — often precede reversals
█ SETTINGS
• Reset Daily: Resets CVD at each session start
• Works best on futures, stocks, and crypto with volume data
█ CREDITS
Inspired by Bookmap's Cumulative Delta indicator.
Skrypt open-source
W zgodzie z duchem TradingView twórca tego skryptu udostępnił go jako open-source, aby użytkownicy mogli przejrzeć i zweryfikować jego działanie. Ukłony dla autora. Korzystanie jest bezpłatne, jednak ponowna publikacja kodu podlega naszym Zasadom serwisu.

Wyłączenie odpowiedzialności
Informacje i publikacje nie stanowią i nie powinny być traktowane jako porady finansowe, inwestycyjne, tradingowe ani jakiekolwiek inne rekomendacje dostarczane lub zatwierdzone przez TradingView. Więcej informacji znajduje się w Warunkach użytkowania.
Skrypt open-source
W zgodzie z duchem TradingView twórca tego skryptu udostępnił go jako open-source, aby użytkownicy mogli przejrzeć i zweryfikować jego działanie. Ukłony dla autora. Korzystanie jest bezpłatne, jednak ponowna publikacja kodu podlega naszym Zasadom serwisu.
Wyłączenie odpowiedzialności
Informacje i publikacje nie stanowią i nie powinny być traktowane jako porady finansowe, inwestycyjne, tradingowe ani jakiekolwiek inne rekomendacje dostarczane lub zatwierdzone przez TradingView. Więcej informacji znajduje się w Warunkach użytkowania.