Volume Profile - Pivot Anchored Pro [JPT]
🔷 OVERVIEW
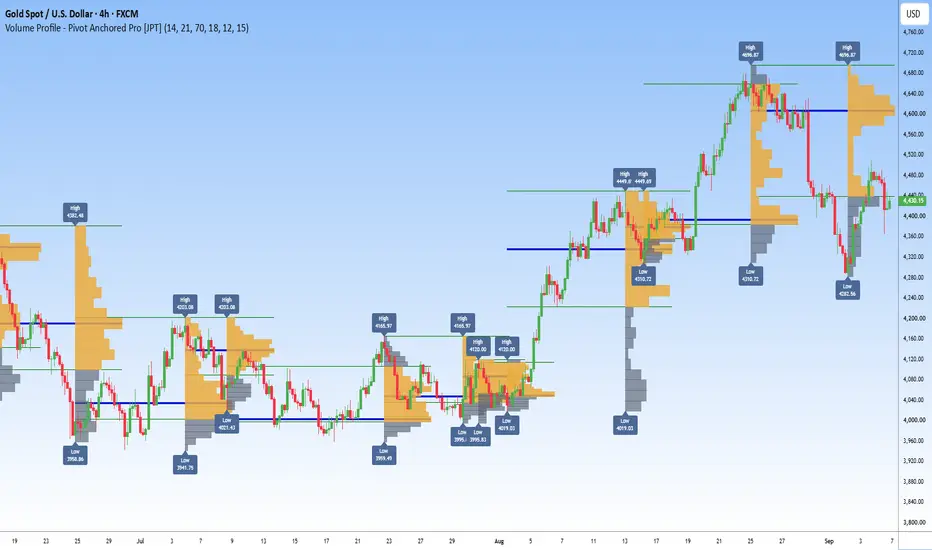
Volume Profile – Pivot Anchored Pro [JPT]is an educational volume analysis indicator that automatically creates volume profiles between confirmed swing highs and swing lows. It helps traders visualize where significant trading activity occurred throughout each market swing.
The indicator displays important volume-based levels including the Point of Control (POC) and Value Area High/Low (VAH/VAL), allowing traders to study areas where price may have experienced strong acceptance or rejection.
The indicator is designed to help traders analyze market structure, volume distribution, and key price areas. It does not predict future price movement or guarantee profitable trades.
🔷 FEATURES
• Automatic pivot high and pivot low detection
• Pivot-to-pivot volume profile generation
• Bullish and bearish volume visualization
• POC (Point of Control) level
• VAH (Value Area High) level
• VAL (Value Area Low) level
• High and Low labels for each profile
• Multiple historical volume profiles
• Customizable profile rows
• Adjustable Value Area percentage
• Adjustable profile width
• Customizable colors and display settings
• Clean chart layout with minimal clutter
🔷 HOW IT WORKS
• Detects confirmed swing highs and swing lows.
• Identifies completed price swings between pivot points.
• Calculates the volume distribution across different price levels within each swing.
• Identifies the POC, representing the price level with the highest traded volume.
• Calculates the Value Area, based on the selected Value Area percentage.
• Displays VAH and VAL to define the upper and lower boundaries of the Value Area.
• Draws the volume profile directly on the chart for easy market analysis.
🔷 HOW TO USE
Look for newly completed pivot-to-pivot volume profiles.
Use the POC to identify important high-volume price levels that may act as areas of support, resistance, or price acceptance.
Use VAH and VAL to understand the boundaries of the Value Area and observe how price reacts around these levels.
Compare multiple profiles to study how volume distribution changes from one market swing to another.
Consider combining the indicator with your own price action, market structure, support/resistance, liquidity, and risk management techniques.
🔷 IMPORTANT NOTE
This indicator is intended for educational and analytical purposes only. Volume Profile levels should be treated as reference areas rather than guaranteed support or resistance.
Always perform your own analysis and use appropriate risk management before making any trading decisions.
Volume Profile – Pivot Anchored Pro [JPT]is an educational volume analysis indicator that automatically creates volume profiles between confirmed swing highs and swing lows. It helps traders visualize where significant trading activity occurred throughout each market swing.
The indicator displays important volume-based levels including the Point of Control (POC) and Value Area High/Low (VAH/VAL), allowing traders to study areas where price may have experienced strong acceptance or rejection.
The indicator is designed to help traders analyze market structure, volume distribution, and key price areas. It does not predict future price movement or guarantee profitable trades.
🔷 FEATURES
• Automatic pivot high and pivot low detection
• Pivot-to-pivot volume profile generation
• Bullish and bearish volume visualization
• POC (Point of Control) level
• VAH (Value Area High) level
• VAL (Value Area Low) level
• High and Low labels for each profile
• Multiple historical volume profiles
• Customizable profile rows
• Adjustable Value Area percentage
• Adjustable profile width
• Customizable colors and display settings
• Clean chart layout with minimal clutter
🔷 HOW IT WORKS
• Detects confirmed swing highs and swing lows.
• Identifies completed price swings between pivot points.
• Calculates the volume distribution across different price levels within each swing.
• Identifies the POC, representing the price level with the highest traded volume.
• Calculates the Value Area, based on the selected Value Area percentage.
• Displays VAH and VAL to define the upper and lower boundaries of the Value Area.
• Draws the volume profile directly on the chart for easy market analysis.
🔷 HOW TO USE
Look for newly completed pivot-to-pivot volume profiles.
Use the POC to identify important high-volume price levels that may act as areas of support, resistance, or price acceptance.
Use VAH and VAL to understand the boundaries of the Value Area and observe how price reacts around these levels.
Compare multiple profiles to study how volume distribution changes from one market swing to another.
Consider combining the indicator with your own price action, market structure, support/resistance, liquidity, and risk management techniques.
🔷 IMPORTANT NOTE
This indicator is intended for educational and analytical purposes only. Volume Profile levels should be treated as reference areas rather than guaranteed support or resistance.
Always perform your own analysis and use appropriate risk management before making any trading decisions.
Volume Profile – Pivot Anchored Pro [JPT] helps you see not only where price moved, but also where the market traded the most volume during each major swing.

📈 FREE TELEGRAM CHANNEL
🥇 Free Daily Forex, Gold & BTC Trade Signals
📚 Daily Trading Lessons & Technical Analysis
Learn, improve, and follow the market with us — completely FREE.
📲 Join Now: t.me/JosProTrader_050
🥇 Free Daily Forex, Gold & BTC Trade Signals
📚 Daily Trading Lessons & Technical Analysis
Learn, improve, and follow the market with us — completely FREE.
📲 Join Now: t.me/JosProTrader_050
Wyłączenie odpowiedzialności
Informacje i publikacje nie stanowią i nie powinny być traktowane jako porady finansowe, inwestycyjne, tradingowe ani jakiekolwiek inne rekomendacje dostarczane lub zatwierdzone przez TradingView. Więcej informacji znajduje się w Warunkach użytkowania.
📈 FREE TELEGRAM CHANNEL
🥇 Free Daily Forex, Gold & BTC Trade Signals
📚 Daily Trading Lessons & Technical Analysis
Learn, improve, and follow the market with us — completely FREE.
📲 Join Now: t.me/JosProTrader_050
🥇 Free Daily Forex, Gold & BTC Trade Signals
📚 Daily Trading Lessons & Technical Analysis
Learn, improve, and follow the market with us — completely FREE.
📲 Join Now: t.me/JosProTrader_050
Wyłączenie odpowiedzialności
Informacje i publikacje nie stanowią i nie powinny być traktowane jako porady finansowe, inwestycyjne, tradingowe ani jakiekolwiek inne rekomendacje dostarczane lub zatwierdzone przez TradingView. Więcej informacji znajduje się w Warunkach użytkowania.