Elite Entries VWAP Fibonacci Bands Premium
**Elite Entries VWAP Fibonacci Bands Premium**
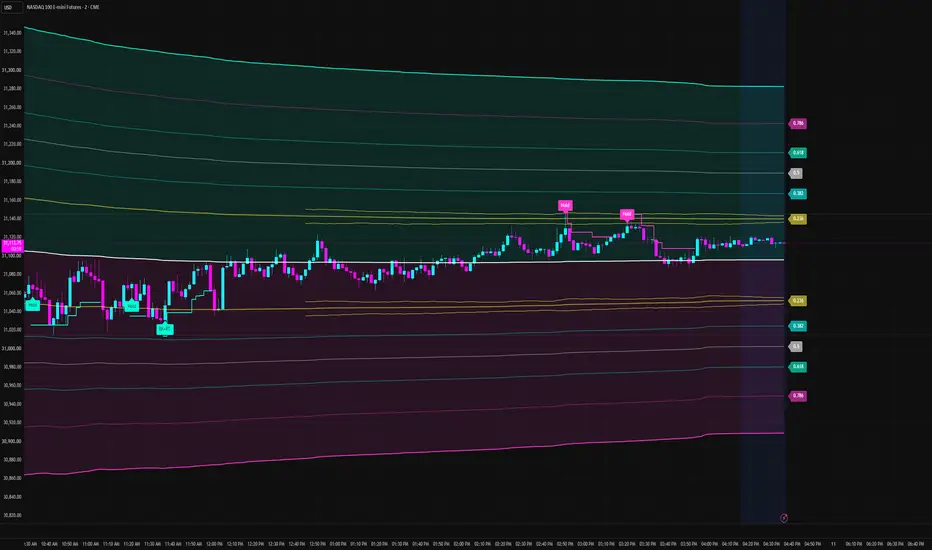
Elite Entries VWAP Fibonacci Bands Premium is an overlay indicator that combines anchored VWAP, volatility-based Fibonacci bands, 23.6 reaction zones, optional breakout filters, and shared trailing-stop tools.
The workflow connects three decisions: where price is trading relative to volume-weighted value, how price responds at a defined zone, and how an accepted signal is managed afterward.
**Acknowledgment**
Credit to **Zimmermann Trading** for inspiring the code and the development of this indicator. That inspiration is acknowledged with appreciation. This acknowledgment does not imply affiliation or endorsement.
**VWAP and Fibonacci Framework**
The central VWAP accumulates typical price, weighted by volume, from a selected timeframe reset or date anchor.
The outer bands use volume-weighted population standard deviation multiplied by a configurable factor. Intermediate bands divide that distance using five configurable ratios, defaulting to:
0.236, 0.382, 0.500, 0.618, and 0.786.
These are ratios within a volatility-based envelope rather than retracements drawn between a selected swing high and swing low. The bands develop as new price and volume data arrive.
**23.6 Reaction Zones**
Two boundaries surround each fixed 23.6 band. Their half-width can use ATR or a specified number of minimum ticks. The reaction zones remain anchored to 0.236 even when the other Fibonacci ratios are customized.
Four optional signal types describe price behavior at these zones:
- **Hold:** Price tests a zone and closes within the permitted defense boundary. Conservative, Balanced, and Aggressive sensitivity settings change the required approach and closing position.
- **Reject:** Price approaches from outside the zone, touches it, and closes on the defended side of its core with matching candle direction.
- **BK+RT:** A close beyond an outer boundary arms a potential return across the zone’s core within the selected bar window. This label represents the break-and-reclaim condition.
- **Accept:** Price meets the required number of consecutive closes beyond an outer boundary after a fresh break. The break candle counts toward the total; a setting of one permits acceptance on that candle.
Reaction signals share a cooldown. When several conditions qualify, priority is BK+RT, Reject, Hold, then Accept. Labels identify the accepted condition without displaying projected targets.
**Breakout Signals and Context Filters**
Optional BRK signals identify confirmed chart-bar closes across enabled VWAP or Fibonacci levels. Crossings caused solely by an anchor reset are excluded.
Breakouts can be filtered using:
- A configurable fast/slow moving-average cloud.
- Multi-timeframe Gann HiLo direction and price position.
- Selected New York, London, or Asian session VWAPs.
These filters apply to BRK signals. The 23.6 reaction signals use their own zone conditions.
The moving-average choices include EMA, SMA, WMA, HMA, RMA, T3, and HEMA. HEMA uses Heikin Ashi closes as its trend input. Session times and timezone are configurable; the default timezone is America/New_York.
**Risk Management Tools**
All accepted signal types can start one shared ATR-based or tick-based trailing stop.
The trail initializes from the standard candle’s confirmed close, including when the chart uses Heikin Ashi candles. Repeated same-direction signals do not reset the original entry.
The stop is evaluated against the standard candle close:
- A long trail ends when a later confirmed candle closes strictly below the previous stop.
- A short trail ends when a later confirmed candle closes strictly above the previous stop.
- Wick breaches and closes exactly on the stop keep the trail active.
The previous stop is checked before calculating the next trailing level. The stop can tighten but does not loosen as ATR changes.
Active-trade gating is enabled by default. While a trail is active, it blocks all new accepted signals and their alerts. A stop-exit candle cannot immediately start another trail.
These are calculated chart references. The indicator does not submit broker orders, track actual account positions, or guarantee execution at a displayed stop.
**Getting Started**
1. Select the VWAP anchor and verify the session timezone.
2. Choose the 23.6 zone width using ATR or ticks.
3. Enable the individual reaction signals you want to display.
4. Enable BRK separately if desired, then select any breakout filters.
5. Configure the shared risk tools and chart appearance.
The reaction-zone master switch is enabled by default, but Hold, Reject, BK+RT, and Accept are individually disabled. The master BREAK switch is also disabled. Enable the desired signal types before expecting signal labels.
Current defaults include a 14-period zone ATR with a 0.5 half-width multiplier, a five-bar reclaim window, one-close acceptance, and a three-bar cooldown. Risk management defaults to ATR 14 with a 1.5 multiplier. The alternative tick-distance settings default to 40 ticks.
**Confirmation, Timeframes, and Alerts**
BRK signals require chart-bar confirmation. When risk management is enabled, reaction signals also require confirmation, even if their separate confirmation checkbox is unchecked.
With risk management and reaction confirmation both disabled, reaction signals can appear provisionally during an open candle and disappear before close or after reload.
Higher-timeframe MA and Gann values use the preceding completed requested candle. Lower-timeframe calculations sample the last available intrabar; they do not reconstruct every intrabar event.
Signal alerts are disabled by default. Enable the desired signal and its alert switch, then create a TradingView alert using “Any alert() function call.” Recreate alerts after changing the script or its settings.
**Use and Limitations**
Use standard time-based candles for the publication chart and signal evaluation. Although risk calculations request standard prices, Heikin Ashi chart prices still affect the band and signal calculations.
Results depend on available history, usable volume, timeframe selection, and data revisions. Developing levels can move while a candle is open. No universal non-repainting, signal-accuracy, or profitability claim is made.
Elite Entries VWAP Fibonacci Bands Premium is an overlay indicator that combines anchored VWAP, volatility-based Fibonacci bands, 23.6 reaction zones, optional breakout filters, and shared trailing-stop tools.
The workflow connects three decisions: where price is trading relative to volume-weighted value, how price responds at a defined zone, and how an accepted signal is managed afterward.
**Acknowledgment**
Credit to **Zimmermann Trading** for inspiring the code and the development of this indicator. That inspiration is acknowledged with appreciation. This acknowledgment does not imply affiliation or endorsement.
**VWAP and Fibonacci Framework**
The central VWAP accumulates typical price, weighted by volume, from a selected timeframe reset or date anchor.
The outer bands use volume-weighted population standard deviation multiplied by a configurable factor. Intermediate bands divide that distance using five configurable ratios, defaulting to:
0.236, 0.382, 0.500, 0.618, and 0.786.
These are ratios within a volatility-based envelope rather than retracements drawn between a selected swing high and swing low. The bands develop as new price and volume data arrive.
**23.6 Reaction Zones**
Two boundaries surround each fixed 23.6 band. Their half-width can use ATR or a specified number of minimum ticks. The reaction zones remain anchored to 0.236 even when the other Fibonacci ratios are customized.
Four optional signal types describe price behavior at these zones:
- **Hold:** Price tests a zone and closes within the permitted defense boundary. Conservative, Balanced, and Aggressive sensitivity settings change the required approach and closing position.
- **Reject:** Price approaches from outside the zone, touches it, and closes on the defended side of its core with matching candle direction.
- **BK+RT:** A close beyond an outer boundary arms a potential return across the zone’s core within the selected bar window. This label represents the break-and-reclaim condition.
- **Accept:** Price meets the required number of consecutive closes beyond an outer boundary after a fresh break. The break candle counts toward the total; a setting of one permits acceptance on that candle.
Reaction signals share a cooldown. When several conditions qualify, priority is BK+RT, Reject, Hold, then Accept. Labels identify the accepted condition without displaying projected targets.
**Breakout Signals and Context Filters**
Optional BRK signals identify confirmed chart-bar closes across enabled VWAP or Fibonacci levels. Crossings caused solely by an anchor reset are excluded.
Breakouts can be filtered using:
- A configurable fast/slow moving-average cloud.
- Multi-timeframe Gann HiLo direction and price position.
- Selected New York, London, or Asian session VWAPs.
These filters apply to BRK signals. The 23.6 reaction signals use their own zone conditions.
The moving-average choices include EMA, SMA, WMA, HMA, RMA, T3, and HEMA. HEMA uses Heikin Ashi closes as its trend input. Session times and timezone are configurable; the default timezone is America/New_York.
**Risk Management Tools**
All accepted signal types can start one shared ATR-based or tick-based trailing stop.
The trail initializes from the standard candle’s confirmed close, including when the chart uses Heikin Ashi candles. Repeated same-direction signals do not reset the original entry.
The stop is evaluated against the standard candle close:
- A long trail ends when a later confirmed candle closes strictly below the previous stop.
- A short trail ends when a later confirmed candle closes strictly above the previous stop.
- Wick breaches and closes exactly on the stop keep the trail active.
The previous stop is checked before calculating the next trailing level. The stop can tighten but does not loosen as ATR changes.
Active-trade gating is enabled by default. While a trail is active, it blocks all new accepted signals and their alerts. A stop-exit candle cannot immediately start another trail.
These are calculated chart references. The indicator does not submit broker orders, track actual account positions, or guarantee execution at a displayed stop.
**Getting Started**
1. Select the VWAP anchor and verify the session timezone.
2. Choose the 23.6 zone width using ATR or ticks.
3. Enable the individual reaction signals you want to display.
4. Enable BRK separately if desired, then select any breakout filters.
5. Configure the shared risk tools and chart appearance.
The reaction-zone master switch is enabled by default, but Hold, Reject, BK+RT, and Accept are individually disabled. The master BREAK switch is also disabled. Enable the desired signal types before expecting signal labels.
Current defaults include a 14-period zone ATR with a 0.5 half-width multiplier, a five-bar reclaim window, one-close acceptance, and a three-bar cooldown. Risk management defaults to ATR 14 with a 1.5 multiplier. The alternative tick-distance settings default to 40 ticks.
**Confirmation, Timeframes, and Alerts**
BRK signals require chart-bar confirmation. When risk management is enabled, reaction signals also require confirmation, even if their separate confirmation checkbox is unchecked.
With risk management and reaction confirmation both disabled, reaction signals can appear provisionally during an open candle and disappear before close or after reload.
Higher-timeframe MA and Gann values use the preceding completed requested candle. Lower-timeframe calculations sample the last available intrabar; they do not reconstruct every intrabar event.
Signal alerts are disabled by default. Enable the desired signal and its alert switch, then create a TradingView alert using “Any alert() function call.” Recreate alerts after changing the script or its settings.
**Use and Limitations**
Use standard time-based candles for the publication chart and signal evaluation. Although risk calculations request standard prices, Heikin Ashi chart prices still affect the band and signal calculations.
Results depend on available history, usable volume, timeframe selection, and data revisions. Developing levels can move while a candle is open. No universal non-repainting, signal-accuracy, or profitability claim is made.

Get access to all indicators, trading strategies, training videos, 1 on 1 coaching, and long term investing alerts for less than $1 a day here! - eliteentries.gumroad.com/l/skduu
Wyłączenie odpowiedzialności
Informacje i publikacje nie stanowią i nie powinny być traktowane jako porady finansowe, inwestycyjne, tradingowe ani jakiekolwiek inne rekomendacje dostarczane lub zatwierdzone przez TradingView. Więcej informacji znajduje się w Warunkach użytkowania.
Get access to all indicators, trading strategies, training videos, 1 on 1 coaching, and long term investing alerts for less than $1 a day here! - eliteentries.gumroad.com/l/skduu
Wyłączenie odpowiedzialności
Informacje i publikacje nie stanowią i nie powinny być traktowane jako porady finansowe, inwestycyjne, tradingowe ani jakiekolwiek inne rekomendacje dostarczane lub zatwierdzone przez TradingView. Więcej informacji znajduje się w Warunkach użytkowania.