Macro Liquidity Z-Score (Smoothed)
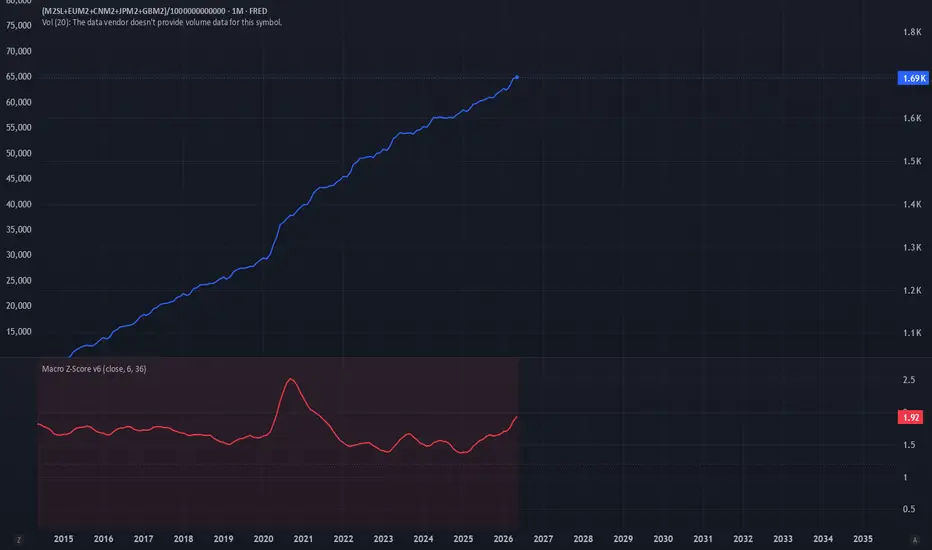
Overview
The Global Liquidity Z-Score Index is a macro-analytical tool designed to track, smooth, and visualise the expansions and contractions of global fiat liquidity. Central bank interventions and monetary policy print the ultimate "tide" that lifts or lowers all risk assets. This indicator standardises global money supply expansion into a clean standard deviation oscillator (Z-Score), helping macro investors identify generational market bottoms and structural cycle peaks.
Unlike traditional economic charts that suffer from heavy month-to-month seasonal reporting noise, this script applies a dual-stage filtering system to isolate the true multi-year structural trend.
How It Works & Calculations
This indicator functions best when applied to a combined custom global M2 ticker string (such as summing the M2 figures of the US, Eurozone, China, Japan, and the UK).The calculation follows two distinct mechanical steps:
1. Seasonality Smoothing: Raw monthly macro data inherently has annual jagged noise due to holiday spending cycles and uneven central bank reporting dates. The script applies a localised Simple Moving Average (SMA) filter to smooth these short-term discrepancies.
2. Statistical Variance (Z-Score): The script then calculates the standard deviation of the smoothed liquidity trend against a long-term rolling baseline. The final formula plots how many standard deviations current global liquidity is deviating from its multi-year mean:
Z = ( x - µ ) / σ
Z = (Where x is the smoothed M2 data, µ is the rolling mean lookback, and σ is the standard deviation).
How to Use & Interpret the Signals
To align this script with major asset class cycles (like the 4-year crypto halving cycles or structural equity regimes), it is highly recommended to use it on the Monthly (1M) time frame with a Z-Score Lookback of 36 or 48 months.
• The Upper "Overheated" Threshold (+1.2 Zone): When the indicator line spikes deep into the upper band and turns red, global central banks are injecting capital at a rate significantly higher than the multi-year average. This represents peak monetary expansion, historically correlating with late-stage bull market euphoria and asset overvaluation. This is a zone to scale out of risk.
• The Lower "Liquidity Floor" Threshold (-1.2 Zone): When the indicator bottoms out into a deep valley and turns green, it highlights severe quantitative tightening or liquidity contraction relative to the trend. Historically, when the line stabilises in this zone and begins curling back upward, it signals a structural market pivot—marking exceptional, low-risk periods for long-term spot asset accumulation.
• The Current Regime: The baseline (0.0) represents perfectly neutral liquidity expansion. Watch for clean, rolling cross-overs of the baseline to identify mid-cycle momentum shifts.
Inputs & Customisation
• Source Data: Defaults to close. Ensure your active chart is loaded with a global M2 tracking formula.
• Seasonality Smoothing: Controls the short-term smoothing filter. Recommended setting: 3 to 6 months to erase reporting noise.
• Z-Score Lookback: Controls the multi-year statistical lens. Recommended setting: 36 to 48 months for macro market cycles.

Wyłączenie odpowiedzialności
Informacje i publikacje nie stanowią i nie powinny być traktowane jako porady finansowe, inwestycyjne, tradingowe ani jakiekolwiek inne rekomendacje dostarczane lub zatwierdzone przez TradingView. Więcej informacji znajduje się w Warunkach użytkowania.
Wyłączenie odpowiedzialności
Informacje i publikacje nie stanowią i nie powinny być traktowane jako porady finansowe, inwestycyjne, tradingowe ani jakiekolwiek inne rekomendacje dostarczane lub zatwierdzone przez TradingView. Więcej informacji znajduje się w Warunkach użytkowania.