OPEN-SOURCE SCRIPT
Strong Volume Map | ProjectSyndicate
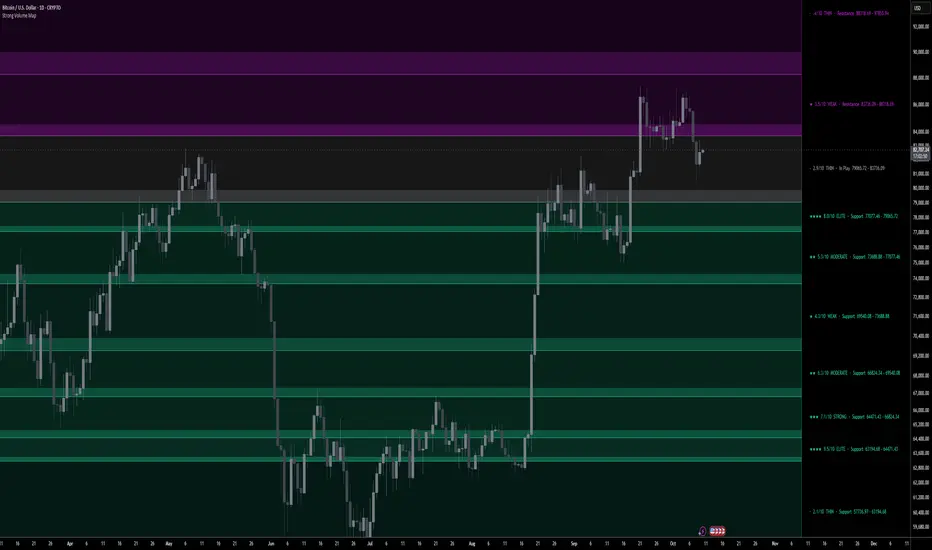
▪️Strong Volume Map takes the one thing every level on your chart is really made of — traded volume — and turns it into a readable map of price. Support and resistance drawn from swing highs and lows is a guess about where people care. Volume at price is the receipt. This indicator reads where business was actually done over your lookback, slices it into equal layers of participation, and lays them across the chart as flat horizontal strata so you can see, at a glance, which prices are solid rock and which are thin air.
▪️The range becomes ten stacked beds, each holding exactly the same slice of volume. Where trading was heavy the beds squeeze thin; where price travelled fast on light volume they stretch wide. Thin means dense means strong. Every layer is scored, graded and labelled with its own record, colored by whether it sits as support below price or resistance above it, and the whole map is rebuilt from the market's own order flow on each closed bar.
▪️Most volume-profile tools bolt a histogram onto the side of the chart and leave you to eyeball the fat part. This one spreads the profile flat across price as shaded zones you trade inside, ranks every layer against the others, marks the strongest and the weakest in plain language, and adds a contrarian exhaustion signal that fires only when price overstretches from fair value on a volume climax.
🗺️ The Volume Map (the core). The lookback window is scanned into a high-resolution volume-at-price profile, then divided into ten horizontal layers that each carry one tenth of the total traded volume. Because every layer holds the same volume, their thickness is the whole story: a thin layer is a price band where a lot of business was packed into a small range — a shelf price has defended — while a thick layer is a vacuum price slipped through. The layers draw behind the candles and extend a set number of bars into the future, so the levels sit waiting where price is heading.
⭐ Strength Score (0–10). Every layer is graded before it is drawn. The score blends two readings: how dense the layer is in absolute terms (how far below the average thickness it compresses) and how it ranks against the other nine layers right now. That mix keeps the scores honest and separated — a quiet range doesn't light up every layer, and a busy one still tells you which shelf is king. The score drives a four-tier grade, a star rating, and a slightly more solid fill on the layers that matter most.
🏛️ The Layer Record, Written On The Chart. Each layer carries its own label, not a shared legend: a star rating, its score out of ten, its tier — ELITE, STRONG, MODERATE, WEAK or THIN — the side it is working as, and its exact price range. ELITE and STRONG layers are the high-volume shelves to lean on; THIN layers are the gaps price tends to move through quickly. Labels that would collide are thinned automatically so only the stronger of two overlapping reads survives, and a minimum-score filter clears the clutter when you only want the shelves that count.
🎨 Support, Resistance & In-Play Coloring. The map reads price position live. Layers below the last close are tinted as support, layers above it as resistance, and the single layer price is trading inside is marked in-play, so the structure above and below you is color-separated the instant you look at it. The default palette is teal for support and magenta for resistance; every tone, the fill transparency, the borders and the base shading on each bed are adjustable.
🎯 Exhaustion Fades. A contrarian signal rides on top of the map. The engine tracks a volume-weighted fair value and its dispersion; when a bar stretches a set number of standard deviations past fair value on a volume climax and then rejects back with a tail, it prints a fade triangle — long on a stretched flush lower, short on a stretched spike higher. Wicks alone trigger nothing. Only a confirmed close fires a signal, and a cooldown keeps them from stacking, so what you see on history is what you would have traded live.
🔬 Volume-Weighted Fair Value. Rather than a plain moving average, the fade engine anchors to where volume actually transacted — a rolling volume-weighted mean and its spread. That is the line price is measured against, so "overstretched" means overstretched relative to where business was done, not relative to an arbitrary average.
🔔 Native Alerts. Exhaustion fade long, exhaustion fade short, and a test of a strong support or strong resistance layer, each firing only on confirmed conditions and naming the event and the price. Set the strong-layer threshold where you want the shelf alerts to trip.
🎯 Why this is different. A hand-drawn level treats every price the same. This one measures where volume actually sits, slices participation into equal layers so thickness alone tells you strength, scores and ranks every shelf against the rest, separates support from resistance on the fly, and layers a confirmed, non-repainting exhaustion signal on top — so the map in front of you is built from the market's own record, not from where a line happened to land.
🚀 Built to adapt. The lookback depth, the forward extension, the layer transparency and shading, the whole color palette, the label size and minimum score, and every threshold on the fade engine are inputs — so it fits indices, FX, futures or crypto on any timeframe, from a scalping chart to a swing map.
💡 Cleanest setup: pick a lookback that covers the structure you trade — a few hundred bars for intraday, more for swing — leave the layers drawing behind the candles, and let the strong layers and the fade triangles do the pointing.
🎯 How To Trade It: Two Approaches
Everything comes down to one question: is price sitting on solid rock or in thin air, and is it stretched far enough from fair value to snap back?
⚡ 1) Trade the Shelves: support and resistance from real volume
Use the ELITE and STRONG layers as your levels.
▪️Read the record. A high-scoring layer below price is a shelf buyers built and defended — a place to look for longs on a test and hold. A high-scoring layer above price is a ceiling sellers built — a place to lean short or to take profit into. The thin, low-score layers between them are travel space, not levels.
Trigger: price testing a strong layer and holding, in the direction of the surrounding structure.
Target: the next strong layer in the trade direction; the thin layers in between tend to be crossed quickly.
Invalidation: a decisive close through the shelf. A broken high-volume layer often flips role — former support becomes resistance.
🧱 2) Fade the Stretch: the exhaustion snap-back
Use this on a fade triangle.
▪️Read the record. You want price far from volume-weighted fair value, a volume climax on the rejection bar, and ideally a strong layer sitting behind the signal to catch it. A fade long into an ELITE support layer, or a fade short into an ELITE resistance layer, is the setup leaning on both the stretch and the shelf.
Trigger: the confirmed fade triangle.
Target: fair value, then the nearest strong layer on the way back.
Stop: beyond the rejection bar's extreme.
Watch: price accepting further past the layer instead of snapping back — the stretch kept going, so the fade is done.
✋ Stand down: when the map says wait
Price sitting in a thick, low-score layer with no shelf nearby — there is nothing to lean on.
A fade triangle with no strong layer behind it and price still accepting away from fair value.
Layers that all score alike — the range is balanced, with no dominant shelf to trade against.
Price mid-layer with no test in progress — wait for the touch and let the alert bring you in.
Rule of thumb: ⚡ Strong layer + hold on the test + structure aligned → trade the shelf toward the next strong layer. 🧱 Price overstretched from fair value + volume climax + a strong layer behind it → fade the stretch back toward fair value. ❄️ Thin layer, no nearby shelf, balanced scores → stand down until price reaches a level that means something.
▪️Honest measurement. This is a map of where volume has traded and where price stands relative to it, not a signal service and not a promise that any level will hold. The strength scores are the historical density of each price band over the lookback you set, on this market, in the bars the indicator can see. They describe where business was done, not where it must be done next. Fade signals are recorded on confirmed closes and a live bar can still change until it closes. Layers move as the lookback window rolls forward; a shelf is only as current as the window that built it.
▪️The range becomes ten stacked beds, each holding exactly the same slice of volume. Where trading was heavy the beds squeeze thin; where price travelled fast on light volume they stretch wide. Thin means dense means strong. Every layer is scored, graded and labelled with its own record, colored by whether it sits as support below price or resistance above it, and the whole map is rebuilt from the market's own order flow on each closed bar.
▪️Most volume-profile tools bolt a histogram onto the side of the chart and leave you to eyeball the fat part. This one spreads the profile flat across price as shaded zones you trade inside, ranks every layer against the others, marks the strongest and the weakest in plain language, and adds a contrarian exhaustion signal that fires only when price overstretches from fair value on a volume climax.
🗺️ The Volume Map (the core). The lookback window is scanned into a high-resolution volume-at-price profile, then divided into ten horizontal layers that each carry one tenth of the total traded volume. Because every layer holds the same volume, their thickness is the whole story: a thin layer is a price band where a lot of business was packed into a small range — a shelf price has defended — while a thick layer is a vacuum price slipped through. The layers draw behind the candles and extend a set number of bars into the future, so the levels sit waiting where price is heading.
⭐ Strength Score (0–10). Every layer is graded before it is drawn. The score blends two readings: how dense the layer is in absolute terms (how far below the average thickness it compresses) and how it ranks against the other nine layers right now. That mix keeps the scores honest and separated — a quiet range doesn't light up every layer, and a busy one still tells you which shelf is king. The score drives a four-tier grade, a star rating, and a slightly more solid fill on the layers that matter most.
🏛️ The Layer Record, Written On The Chart. Each layer carries its own label, not a shared legend: a star rating, its score out of ten, its tier — ELITE, STRONG, MODERATE, WEAK or THIN — the side it is working as, and its exact price range. ELITE and STRONG layers are the high-volume shelves to lean on; THIN layers are the gaps price tends to move through quickly. Labels that would collide are thinned automatically so only the stronger of two overlapping reads survives, and a minimum-score filter clears the clutter when you only want the shelves that count.
🎨 Support, Resistance & In-Play Coloring. The map reads price position live. Layers below the last close are tinted as support, layers above it as resistance, and the single layer price is trading inside is marked in-play, so the structure above and below you is color-separated the instant you look at it. The default palette is teal for support and magenta for resistance; every tone, the fill transparency, the borders and the base shading on each bed are adjustable.
🎯 Exhaustion Fades. A contrarian signal rides on top of the map. The engine tracks a volume-weighted fair value and its dispersion; when a bar stretches a set number of standard deviations past fair value on a volume climax and then rejects back with a tail, it prints a fade triangle — long on a stretched flush lower, short on a stretched spike higher. Wicks alone trigger nothing. Only a confirmed close fires a signal, and a cooldown keeps them from stacking, so what you see on history is what you would have traded live.
🔬 Volume-Weighted Fair Value. Rather than a plain moving average, the fade engine anchors to where volume actually transacted — a rolling volume-weighted mean and its spread. That is the line price is measured against, so "overstretched" means overstretched relative to where business was done, not relative to an arbitrary average.
🔔 Native Alerts. Exhaustion fade long, exhaustion fade short, and a test of a strong support or strong resistance layer, each firing only on confirmed conditions and naming the event and the price. Set the strong-layer threshold where you want the shelf alerts to trip.
🎯 Why this is different. A hand-drawn level treats every price the same. This one measures where volume actually sits, slices participation into equal layers so thickness alone tells you strength, scores and ranks every shelf against the rest, separates support from resistance on the fly, and layers a confirmed, non-repainting exhaustion signal on top — so the map in front of you is built from the market's own record, not from where a line happened to land.
🚀 Built to adapt. The lookback depth, the forward extension, the layer transparency and shading, the whole color palette, the label size and minimum score, and every threshold on the fade engine are inputs — so it fits indices, FX, futures or crypto on any timeframe, from a scalping chart to a swing map.
💡 Cleanest setup: pick a lookback that covers the structure you trade — a few hundred bars for intraday, more for swing — leave the layers drawing behind the candles, and let the strong layers and the fade triangles do the pointing.
🎯 How To Trade It: Two Approaches
Everything comes down to one question: is price sitting on solid rock or in thin air, and is it stretched far enough from fair value to snap back?
⚡ 1) Trade the Shelves: support and resistance from real volume
Use the ELITE and STRONG layers as your levels.
▪️Read the record. A high-scoring layer below price is a shelf buyers built and defended — a place to look for longs on a test and hold. A high-scoring layer above price is a ceiling sellers built — a place to lean short or to take profit into. The thin, low-score layers between them are travel space, not levels.
Trigger: price testing a strong layer and holding, in the direction of the surrounding structure.
Target: the next strong layer in the trade direction; the thin layers in between tend to be crossed quickly.
Invalidation: a decisive close through the shelf. A broken high-volume layer often flips role — former support becomes resistance.
🧱 2) Fade the Stretch: the exhaustion snap-back
Use this on a fade triangle.
▪️Read the record. You want price far from volume-weighted fair value, a volume climax on the rejection bar, and ideally a strong layer sitting behind the signal to catch it. A fade long into an ELITE support layer, or a fade short into an ELITE resistance layer, is the setup leaning on both the stretch and the shelf.
Trigger: the confirmed fade triangle.
Target: fair value, then the nearest strong layer on the way back.
Stop: beyond the rejection bar's extreme.
Watch: price accepting further past the layer instead of snapping back — the stretch kept going, so the fade is done.
✋ Stand down: when the map says wait
Price sitting in a thick, low-score layer with no shelf nearby — there is nothing to lean on.
A fade triangle with no strong layer behind it and price still accepting away from fair value.
Layers that all score alike — the range is balanced, with no dominant shelf to trade against.
Price mid-layer with no test in progress — wait for the touch and let the alert bring you in.
Rule of thumb: ⚡ Strong layer + hold on the test + structure aligned → trade the shelf toward the next strong layer. 🧱 Price overstretched from fair value + volume climax + a strong layer behind it → fade the stretch back toward fair value. ❄️ Thin layer, no nearby shelf, balanced scores → stand down until price reaches a level that means something.
▪️Honest measurement. This is a map of where volume has traded and where price stands relative to it, not a signal service and not a promise that any level will hold. The strength scores are the historical density of each price band over the lookback you set, on this market, in the bars the indicator can see. They describe where business was done, not where it must be done next. Fade signals are recorded on confirmed closes and a live bar can still change until it closes. Layers move as the lookback window rolls forward; a shelf is only as current as the window that built it.
Skrypt open-source
W zgodzie z duchem TradingView twórca tego skryptu udostępnił go jako open-source, aby użytkownicy mogli przejrzeć i zweryfikować jego działanie. Ukłony dla autora. Korzystanie jest bezpłatne, jednak ponowna publikacja kodu podlega naszym Zasadom serwisu.

Gold Algo Trading · +1100% YTD · max DD <5%
Syndicate Ultimate · 5 algo systems · 1 bundle
1 payment · lifetime access · no monthly fees
+ FX · NQ/ES · 10+ yr institutional desk
syndicate001.com
Join on Telegram
t.me/aisyndicate001
Syndicate Ultimate · 5 algo systems · 1 bundle
1 payment · lifetime access · no monthly fees
+ FX · NQ/ES · 10+ yr institutional desk
syndicate001.com
Join on Telegram
t.me/aisyndicate001
Wyłączenie odpowiedzialności
Informacje i publikacje nie stanowią i nie powinny być traktowane jako porady finansowe, inwestycyjne, tradingowe ani jakiekolwiek inne rekomendacje dostarczane lub zatwierdzone przez TradingView. Więcej informacji znajduje się w Warunkach użytkowania.
Skrypt open-source
W zgodzie z duchem TradingView twórca tego skryptu udostępnił go jako open-source, aby użytkownicy mogli przejrzeć i zweryfikować jego działanie. Ukłony dla autora. Korzystanie jest bezpłatne, jednak ponowna publikacja kodu podlega naszym Zasadom serwisu.
Gold Algo Trading · +1100% YTD · max DD <5%
Syndicate Ultimate · 5 algo systems · 1 bundle
1 payment · lifetime access · no monthly fees
+ FX · NQ/ES · 10+ yr institutional desk
syndicate001.com
Join on Telegram
t.me/aisyndicate001
Syndicate Ultimate · 5 algo systems · 1 bundle
1 payment · lifetime access · no monthly fees
+ FX · NQ/ES · 10+ yr institutional desk
syndicate001.com
Join on Telegram
t.me/aisyndicate001
Wyłączenie odpowiedzialności
Informacje i publikacje nie stanowią i nie powinny być traktowane jako porady finansowe, inwestycyjne, tradingowe ani jakiekolwiek inne rekomendacje dostarczane lub zatwierdzone przez TradingView. Więcej informacji znajduje się w Warunkach użytkowania.