MA Shift
MA Shift
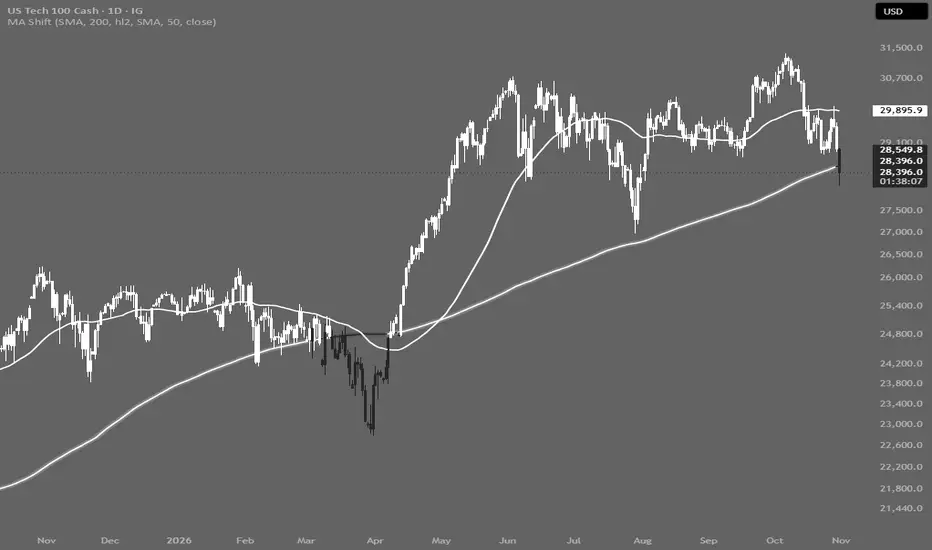
MA Shift is a clean trend overlay that recolors your chart based on where price sits relative to a long-term moving average.
How it works
A main moving average (200-period SMA of hl2 by default) defines the trend regime.
When price is above the main MA, candles and the MA line turn the “Up” color (white by default); when price is below it, they switch to the “Down” color (dark gray by default).
A soft glow is drawn behind the main MA to make it stand out on the chart.
An optional second moving average (50-period SMA of close by default) is plotted in a fixed color, with no color changes, as a shorter-term reference.
Features
Choose between SMA, EMA, RMA, WMA and VWMA for both moving averages.
Adjustable length, source and colors for each MA.
Toggle the MA 50 on or off.
Candles are drawn in front of the chart’s own bars, so the color scheme shows correctly without changing the visual order manually.
Built-in alerts when price crosses above or below the main MA.
Use case
Designed for a quick read of the broader trend at a glance: the chart color tells you which side of the long-term average you are on, while the MA 50 helps track the intermediate trend and pullbacks toward the 200.
MA Shift is a clean trend overlay that recolors your chart based on where price sits relative to a long-term moving average.
How it works
A main moving average (200-period SMA of hl2 by default) defines the trend regime.
When price is above the main MA, candles and the MA line turn the “Up” color (white by default); when price is below it, they switch to the “Down” color (dark gray by default).
A soft glow is drawn behind the main MA to make it stand out on the chart.
An optional second moving average (50-period SMA of close by default) is plotted in a fixed color, with no color changes, as a shorter-term reference.
Features
Choose between SMA, EMA, RMA, WMA and VWMA for both moving averages.
Adjustable length, source and colors for each MA.
Toggle the MA 50 on or off.
Candles are drawn in front of the chart’s own bars, so the color scheme shows correctly without changing the visual order manually.
Built-in alerts when price crosses above or below the main MA.
Use case
Designed for a quick read of the broader trend at a glance: the chart color tells you which side of the long-term average you are on, while the MA 50 helps track the intermediate trend and pullbacks toward the 200.

Wyłączenie odpowiedzialności
Informacje i publikacje nie stanowią i nie powinny być traktowane jako porady finansowe, inwestycyjne, tradingowe ani jakiekolwiek inne rekomendacje dostarczane lub zatwierdzone przez TradingView. Więcej informacji znajduje się w Warunkach użytkowania.
Wyłączenie odpowiedzialności
Informacje i publikacje nie stanowią i nie powinny być traktowane jako porady finansowe, inwestycyjne, tradingowe ani jakiekolwiek inne rekomendacje dostarczane lub zatwierdzone przez TradingView. Więcej informacji znajduje się w Warunkach użytkowania.