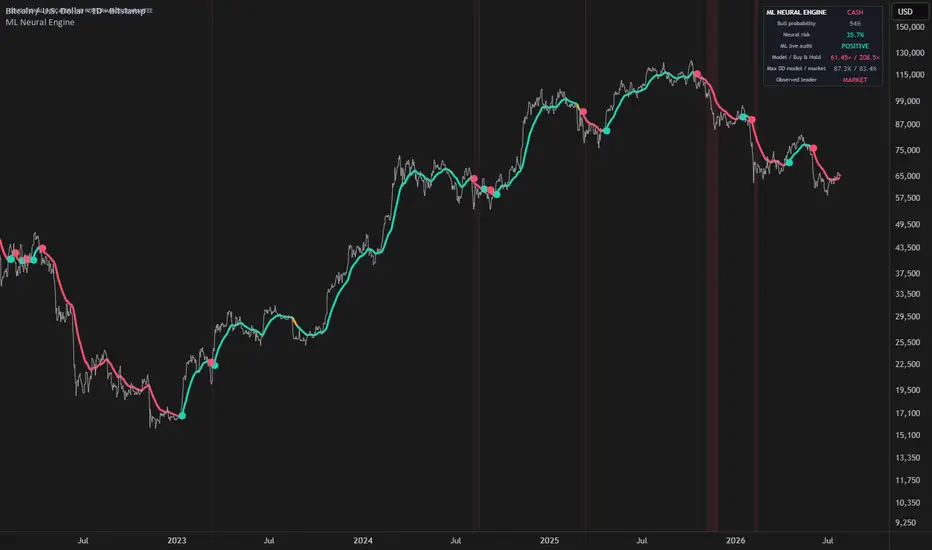
Machine Learning Neural Network Engine turns complex Daily market behavior into three clear states: LONG, WATCH and CASH.
Instead of relying on one fixed trend signal, the indicator combines an adaptive neural network, continuous model validation and an independent crisis detector. The result is a simple visual interface backed by a fully causal machine-learning process.
HOW IT WORKS
At its core is a compact 6-5-1 neural network trained directly on the chart.
It analyzes six normalized features:
The network learns sequentially from completed market outcomes. On each confirmed Daily bar, it can only train on information from an earlier bar whose result has become known. Current predictions never use future data.
Training uses nonlinear neurons, RMS-scaled gradient updates, error clipping and regularization. This is an adaptive online model, not a set of fixed coefficients labelled as machine learning.
SELF-AUDITING MACHINE LEARNING
The neural network is continuously compared with an independent structural trend model.
When the network’s matured predictions provide useful additional information, its influence increases. When its recent error becomes worse than the structural baseline, its influence is automatically reduced.
This live validation mechanism prevents the indicator from trusting its machine-learning component unconditionally.
CRISIS DETECTION
A separate stress engine monitors:
This layer can trigger a defensive state independently of the neural model, helping the indicator respond to sudden market deterioration.
HOW TO READ IT
LONG — Green
The model, trend structure and confirmation rules support a constructive market environment.
WATCH — Amber
The market remains structurally LONG, but risk or exit evidence is increasing.
CASH — Red
The environment is defensive because of persistent weakness or confirmed crisis stress. The indicator never takes short positions.
The colored neural axis and surrounding halo display the active state without covering the chart with labels. Transition pulses identify confirmed changes, while the dashboard shows bull probability, neural risk and the current machine-learning audit.
WHAT MAKES IT DIFFERENT
The script integrates four distinct functions:
1. Online neural-network learning
2. Live error-based model validation
3. Independent downside-stress detection
4. A confirmed state machine designed to limit excessive switching
These components are not combined as a simple indicator vote. Each has a separate role in learning, validation, protection or state stabilization.
SETTINGS
ML response controls adaptation speed and signal stability:
ML selectivity controls how much evidence is required before LONG or CASH is confirmed.
The indicator is designed exclusively for standard Daily charts.
BUILT-IN COMPARISON
The dashboard includes a lagged long/cash comparison with buy-and-hold. It applies the selected transition cost and openly displays periods when the model underperforms.
This comparison is a diagnostic tool, not a complete strategy backtest. It does not include every possible spread, slippage, tax, financing or execution constraint.
IMPORTANT LIMITATIONS
The bull probability is an internal normalized score, not a statistically calibrated probability of profit. The model can react late, generate false transitions in sideways markets and cannot eliminate gap risk.
The developing Daily bar may change before closing. Confirmed historical states use no future data, no lookahead and no higher-timeframe security calls.
This indicator provides market context, not financial advice or guaranteed performance. Online learning does not imply future outperformance.
Instead of relying on one fixed trend signal, the indicator combines an adaptive neural network, continuous model validation and an independent crisis detector. The result is a simple visual interface backed by a fully causal machine-learning process.
HOW IT WORKS
At its core is a compact 6-5-1 neural network trained directly on the chart.
It analyzes six normalized features:
- Short- and medium-term trend structure
- RSI momentum
- Deviation from linear regression
- Directional price efficiency
- Relative volatility
- Candle pressure adjusted by relative volume
The network learns sequentially from completed market outcomes. On each confirmed Daily bar, it can only train on information from an earlier bar whose result has become known. Current predictions never use future data.
Training uses nonlinear neurons, RMS-scaled gradient updates, error clipping and regularization. This is an adaptive online model, not a set of fixed coefficients labelled as machine learning.
SELF-AUDITING MACHINE LEARNING
The neural network is continuously compared with an independent structural trend model.
When the network’s matured predictions provide useful additional information, its influence increases. When its recent error becomes worse than the structural baseline, its influence is automatically reduced.
This live validation mechanism prevents the indicator from trusting its machine-learning component unconditionally.
CRISIS DETECTION
A separate stress engine monitors:
- Rapid 10-day declines
- Drawdown from the 63-day high
- Abnormal ATR expansion
- Long-term price structure
This layer can trigger a defensive state independently of the neural model, helping the indicator respond to sudden market deterioration.
HOW TO READ IT
LONG — Green
The model, trend structure and confirmation rules support a constructive market environment.
WATCH — Amber
The market remains structurally LONG, but risk or exit evidence is increasing.
CASH — Red
The environment is defensive because of persistent weakness or confirmed crisis stress. The indicator never takes short positions.
The colored neural axis and surrounding halo display the active state without covering the chart with labels. Transition pulses identify confirmed changes, while the dashboard shows bull probability, neural risk and the current machine-learning audit.
WHAT MAKES IT DIFFERENT
The script integrates four distinct functions:
1. Online neural-network learning
2. Live error-based model validation
3. Independent downside-stress detection
4. A confirmed state machine designed to limit excessive switching
These components are not combined as a simple indicator vote. Each has a separate role in learning, validation, protection or state stabilization.
SETTINGS
ML response controls adaptation speed and signal stability:
- Fast reacts sooner.
- Balanced is the recommended starting point.
- Smooth prioritizes stability.
ML selectivity controls how much evidence is required before LONG or CASH is confirmed.
The indicator is designed exclusively for standard Daily charts.
BUILT-IN COMPARISON
The dashboard includes a lagged long/cash comparison with buy-and-hold. It applies the selected transition cost and openly displays periods when the model underperforms.
This comparison is a diagnostic tool, not a complete strategy backtest. It does not include every possible spread, slippage, tax, financing or execution constraint.
IMPORTANT LIMITATIONS
The bull probability is an internal normalized score, not a statistically calibrated probability of profit. The model can react late, generate false transitions in sideways markets and cannot eliminate gap risk.
The developing Daily bar may change before closing. Confirmed historical states use no future data, no lookahead and no higher-timeframe security calls.
This indicator provides market context, not financial advice or guaranteed performance. Online learning does not imply future outperformance.
Skrypt open-source
W zgodzie z duchem TradingView twórca tego skryptu udostępnił go jako open-source, aby użytkownicy mogli przejrzeć i zweryfikować jego działanie. Ukłony dla autora. Korzystanie jest bezpłatne, jednak ponowna publikacja kodu podlega naszym Zasadom serwisu.

Plan the trade ⚡ Trade the plan
Wyłączenie odpowiedzialności
Informacje i publikacje nie stanowią i nie powinny być traktowane jako porady finansowe, inwestycyjne, tradingowe ani jakiekolwiek inne rekomendacje dostarczane lub zatwierdzone przez TradingView. Więcej informacji znajduje się w Warunkach użytkowania.
Skrypt open-source
W zgodzie z duchem TradingView twórca tego skryptu udostępnił go jako open-source, aby użytkownicy mogli przejrzeć i zweryfikować jego działanie. Ukłony dla autora. Korzystanie jest bezpłatne, jednak ponowna publikacja kodu podlega naszym Zasadom serwisu.
Plan the trade ⚡ Trade the plan
Wyłączenie odpowiedzialności
Informacje i publikacje nie stanowią i nie powinny być traktowane jako porady finansowe, inwestycyjne, tradingowe ani jakiekolwiek inne rekomendacje dostarczane lub zatwierdzone przez TradingView. Więcej informacji znajduje się w Warunkach użytkowania.