RSI Extreme Reversals (Percentile Floor)
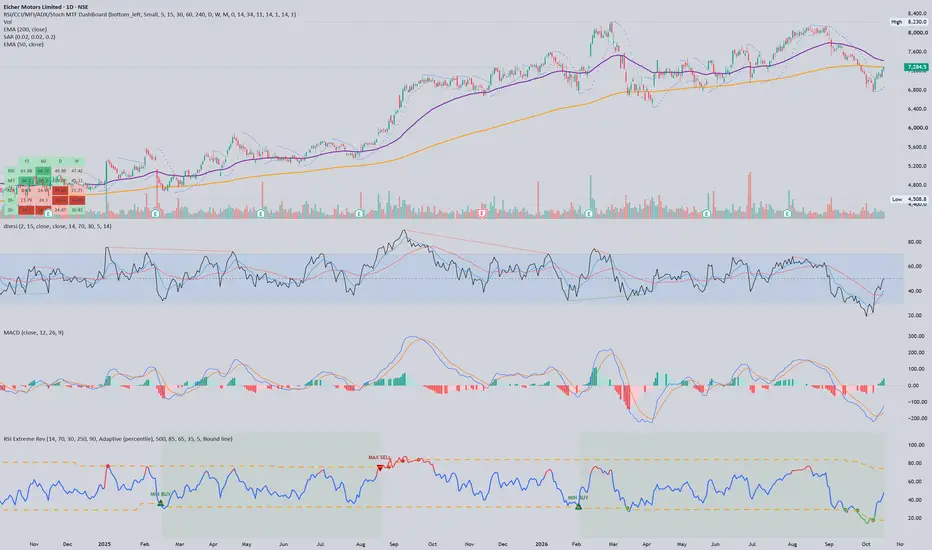
# RSI Extreme Reversals (Percentile Floor): write-up
## Overview
This is a TradingView indicator that gives simple, rule-based buy and sell signals from a stock's own RSI history. It works on one idea: when RSI reaches an unusually low or high level for that particular stock, price is stretched and a reversal is more likely. Instead of using fixed 30/70 levels, the script measures what "extreme" means for each stock.
The signals follow one rule, Rule A:
- **MIN BUY** when RSI drops to the stock's extreme-low line.
- **MAX SELL** when RSI rises to the stock's extreme-high line.
- **Hold in between.** You are long from a MIN BUY until the next MAX SELL. There is no stop-loss and no other exit, so risk control is left to the user.
The script marks signals and sends alerts. It does not place trades.
## How the signal is built
1. **RSI.** A 14-period RSI on OHLC4, the average of open, high, low and close. This is smoother than a close-only RSI, and you can switch to close-only.
2. **The stock's own range.** The script finds the highest and lowest RSI over the previous 301 bars. It uses prior bars only, so the current bar never sets its own threshold.
3. **Extreme lines.** The upper line is 50 plus 90% of the distance from 50 to that high. The lower line is 50 minus 90% of the distance from 50 to that low. These are the dashed orange lines, and they move as the stock's behaviour changes.
4. **Percentile floor.** The lines can't sit closer to 50 than the stock's own 85th and 15th RSI percentiles over the last 500 bars. This keeps a quiet, low-volatility stock from producing "extreme" signals at ordinary RSI levels. Because the floor comes from the stock's own history, it is stock-specific rather than a fixed 65/35.
5. **Touch trigger.** A signal fires on the bar where RSI crosses into the extreme zone, not when it leaves it.
6. **Guard rails.**
- Signals fire only on confirmed bar closes, so they don't flicker or repaint.
- A 5-bar cooldown stops repeated signals of the same type.
- Nothing fires until there is enough history for the lookback and the floor, about the first two years of a daily chart.
## What you see on the chart
- **RSI line.** It is red at 70 or above, green at 30 or below, and blue otherwise.
- **Dashed orange lines.** The extreme upper and lower lines.
- **Dark triangles.** A dark green MIN BUY and a dark red MAX SELL, drawn on the line where RSI touched. These are the real signals. A MIN BUY shows only when you're flat, and a MAX SELL only when you're long.
- **Small circles with a dark blue ring.** These are repeat touches after a signal, such as another dip to the lower line while you're still long. They are for information only, nothing is meant to be traded on them, and they never alert. Nothing shows before the first real signal.
- **Green shading.** It marks the bars where Rule A would be holding a position.
- **Alerts.** One for MIN BUY and one for MAX SELL, filled at the next bar's open.
## Settings
| Setting | Default | What it does |
|---|---|---|
| RSI length | 14 | The RSI period |
| OHLC4 RSI | On | Uses the average price instead of the close |
| Lookback window | 301 bars | How far back the highest and lowest RSI are measured |
| Extreme sensitivity | 90% | How close to the historical extreme the lines sit |
| Floor mode | Adaptive | Adaptive percentile, fixed 65/35, or off |
| Floor window and percentile | 500 bars, 85th | How the adaptive floor is measured |
| Cooldown | 5 bars | Minimum gap between same-type signals |
| Marker position | Bound line | Draws markers on the dashed lines or on the RSI line |
Lower sensitivity makes the lines move toward 50, which gives more signals and more false ones. Higher sensitivity gives fewer, more extreme signals.
## Strengths
- **Stock-specific.** The lines and floors adapt to each stock's own behaviour, so one setting works across stocks with different volatility.
- **Simple rule.** There are two signals, one position at a time, and no stacking of conditions to optimise.
- **No repainting.** Bounds use prior bars, and signals appear only on confirmed closes.
- **Clear chart.** Real signals, repeat touches and the holding period are visually separate.
## Limitations
- **Buying on a touch means buying while it's still falling.** The stock may keep dropping after the signal. This is the main source of large losing trades.
- **There is no exit other than MAX SELL.** If a stock stops generating sell signals, the position stays open. A stop-loss, a time limit or position sizing is up to you.
- **It signals rarely.** Because the lines sit at a stock's historical extremes, it produces few signals per stock. It is a patient, long-holding approach.
- **The entry signal alone isn't a proven edge.** In my testing, much of the outcome came from holding until the sell signal, not from timing the entry.
- **Results depend on the stock and period.** The rule tends to look better in rising markets and on stocks that already trend upward. It hasn't been tested through a long bear phase, and choosing stocks for their past performance flatters any result.
- **It works best on daily charts.** Other timeframes may behave differently and haven't been tested.
- **Not compiled in TradingView.** I wrote the script but couldn't run it there. The ring around the circles is a text-character workaround and may need a size tweak.
## Using it well
- **Spread across several stocks** instead of concentrating in one, since a single position can fall sharply before a sell signal arrives.
- **Size each position** so a large loss in any one stock is survivable.
- **Set your own stop-loss rule** if you want one. The script doesn't include it by design.
- **Check the signals on your own stocks** by scrolling through the history before relying on them. This is a signal tool, not investment advice, and past patterns don't guarantee future results.
I
## Overview
This is a TradingView indicator that gives simple, rule-based buy and sell signals from a stock's own RSI history. It works on one idea: when RSI reaches an unusually low or high level for that particular stock, price is stretched and a reversal is more likely. Instead of using fixed 30/70 levels, the script measures what "extreme" means for each stock.
The signals follow one rule, Rule A:
- **MIN BUY** when RSI drops to the stock's extreme-low line.
- **MAX SELL** when RSI rises to the stock's extreme-high line.
- **Hold in between.** You are long from a MIN BUY until the next MAX SELL. There is no stop-loss and no other exit, so risk control is left to the user.
The script marks signals and sends alerts. It does not place trades.
## How the signal is built
1. **RSI.** A 14-period RSI on OHLC4, the average of open, high, low and close. This is smoother than a close-only RSI, and you can switch to close-only.
2. **The stock's own range.** The script finds the highest and lowest RSI over the previous 301 bars. It uses prior bars only, so the current bar never sets its own threshold.
3. **Extreme lines.** The upper line is 50 plus 90% of the distance from 50 to that high. The lower line is 50 minus 90% of the distance from 50 to that low. These are the dashed orange lines, and they move as the stock's behaviour changes.
4. **Percentile floor.** The lines can't sit closer to 50 than the stock's own 85th and 15th RSI percentiles over the last 500 bars. This keeps a quiet, low-volatility stock from producing "extreme" signals at ordinary RSI levels. Because the floor comes from the stock's own history, it is stock-specific rather than a fixed 65/35.
5. **Touch trigger.** A signal fires on the bar where RSI crosses into the extreme zone, not when it leaves it.
6. **Guard rails.**
- Signals fire only on confirmed bar closes, so they don't flicker or repaint.
- A 5-bar cooldown stops repeated signals of the same type.
- Nothing fires until there is enough history for the lookback and the floor, about the first two years of a daily chart.
## What you see on the chart
- **RSI line.** It is red at 70 or above, green at 30 or below, and blue otherwise.
- **Dashed orange lines.** The extreme upper and lower lines.
- **Dark triangles.** A dark green MIN BUY and a dark red MAX SELL, drawn on the line where RSI touched. These are the real signals. A MIN BUY shows only when you're flat, and a MAX SELL only when you're long.
- **Small circles with a dark blue ring.** These are repeat touches after a signal, such as another dip to the lower line while you're still long. They are for information only, nothing is meant to be traded on them, and they never alert. Nothing shows before the first real signal.
- **Green shading.** It marks the bars where Rule A would be holding a position.
- **Alerts.** One for MIN BUY and one for MAX SELL, filled at the next bar's open.
## Settings
| Setting | Default | What it does |
|---|---|---|
| RSI length | 14 | The RSI period |
| OHLC4 RSI | On | Uses the average price instead of the close |
| Lookback window | 301 bars | How far back the highest and lowest RSI are measured |
| Extreme sensitivity | 90% | How close to the historical extreme the lines sit |
| Floor mode | Adaptive | Adaptive percentile, fixed 65/35, or off |
| Floor window and percentile | 500 bars, 85th | How the adaptive floor is measured |
| Cooldown | 5 bars | Minimum gap between same-type signals |
| Marker position | Bound line | Draws markers on the dashed lines or on the RSI line |
Lower sensitivity makes the lines move toward 50, which gives more signals and more false ones. Higher sensitivity gives fewer, more extreme signals.
## Strengths
- **Stock-specific.** The lines and floors adapt to each stock's own behaviour, so one setting works across stocks with different volatility.
- **Simple rule.** There are two signals, one position at a time, and no stacking of conditions to optimise.
- **No repainting.** Bounds use prior bars, and signals appear only on confirmed closes.
- **Clear chart.** Real signals, repeat touches and the holding period are visually separate.
## Limitations
- **Buying on a touch means buying while it's still falling.** The stock may keep dropping after the signal. This is the main source of large losing trades.
- **There is no exit other than MAX SELL.** If a stock stops generating sell signals, the position stays open. A stop-loss, a time limit or position sizing is up to you.
- **It signals rarely.** Because the lines sit at a stock's historical extremes, it produces few signals per stock. It is a patient, long-holding approach.
- **The entry signal alone isn't a proven edge.** In my testing, much of the outcome came from holding until the sell signal, not from timing the entry.
- **Results depend on the stock and period.** The rule tends to look better in rising markets and on stocks that already trend upward. It hasn't been tested through a long bear phase, and choosing stocks for their past performance flatters any result.
- **It works best on daily charts.** Other timeframes may behave differently and haven't been tested.
- **Not compiled in TradingView.** I wrote the script but couldn't run it there. The ring around the circles is a text-character workaround and may need a size tweak.
## Using it well
- **Spread across several stocks** instead of concentrating in one, since a single position can fall sharply before a sell signal arrives.
- **Size each position** so a large loss in any one stock is survivable.
- **Set your own stop-loss rule** if you want one. The script doesn't include it by design.
- **Check the signals on your own stocks** by scrolling through the history before relying on them. This is a signal tool, not investment advice, and past patterns don't guarantee future results.
I

Wyłączenie odpowiedzialności
Informacje i publikacje nie stanowią i nie powinny być traktowane jako porady finansowe, inwestycyjne, tradingowe ani jakiekolwiek inne rekomendacje dostarczane lub zatwierdzone przez TradingView. Więcej informacji znajduje się w Warunkach użytkowania.
Wyłączenie odpowiedzialności
Informacje i publikacje nie stanowią i nie powinny być traktowane jako porady finansowe, inwestycyjne, tradingowe ani jakiekolwiek inne rekomendacje dostarczane lub zatwierdzone przez TradingView. Więcej informacji znajduje się w Warunkach użytkowania.