OPEN-SOURCE SCRIPT
Valence MACE | EMA Consensus Engine
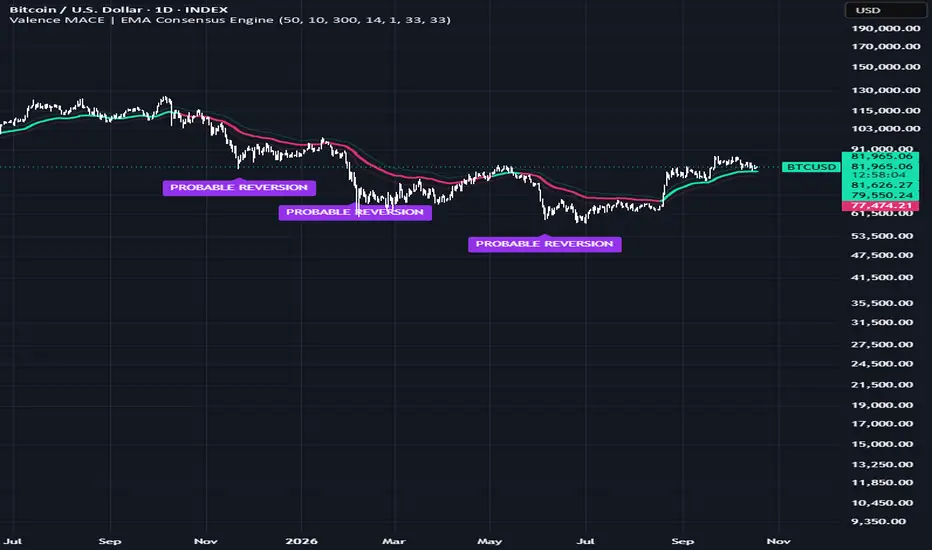
# Valence MACE | EMA Consensus Engine
## Overview
Valence MACE (Moving Average Consensus Engine) is a trend-following indicator designed to identify directional market conditions by combining multiple Exponential Moving Averages (EMAs) into a single composite trend line.
Rather than relying on one moving average with a fixed lookback period, MACE calculates a collection of EMAs across different lengths and averages their values to produce a unified representation of price trends.
The indicator also incorporates an Average True Range (ATR) volatility filter to reduce frequent trend-state changes during periods of market noise, alongside an independent Relative Strength Index (RSI) module that highlights potential mean-reversion conditions.
MACE is designed to provide a visually straightforward way to evaluate market direction while retaining configurable sensitivity to price movements and volatility.
## How It Works
### 1. EMA Consensus Engine
The foundation of MACE is a composite moving average constructed from multiple EMAs.
By default, the indicator calculates 50 EMAs, with lengths ranging from 10 to 300 periods.
The EMA lengths are distributed geometrically rather than linearly. This provides coverage across shorter and longer smoothing horizons without manually selecting every individual period.
Each EMA is calculated using conventional exponential smoothing:
EMA = (Current Price × Alpha) + (Previous EMA × (1 − Alpha))
Where:
Alpha = 2 / (EMA Length + 1)
The resulting EMA values are then combined using an equally weighted arithmetic average:
Composite EMA = Sum of All EMA Values / Number of EMAs
Each EMA contributes equally to the composite calculation.
Importantly, MACE averages the numerical values of the EMAs rather than counting how many individual EMAs are bullish or bearish.
The resulting composite is plotted directly over price.
### 2. ATR Volatility Filter
A common limitation of moving-average trend indicators is their tendency to produce frequent bullish and bearish transitions when price fluctuates around the moving average.
MACE addresses this through an ATR-based volatility buffer.
Two thresholds are calculated:
- Upper Threshold = Composite EMA + (ATR × Multiplier)
- Lower Threshold = Composite EMA − (ATR × Multiplier)
A bullish trend is confirmed when price closes above the upper threshold.
A bearish trend is confirmed when price closes below the lower threshold.
When price remains between these thresholds, the indicator maintains its previous confirmed trend state.
This approach introduces hysteresis, meaning that a trend reversal requires a sufficiently large movement beyond the composite EMA rather than a minor crossing.
The ATR multiplier is adjustable, allowing users to control the balance between responsiveness and noise reduction.
Higher multipliers generally require larger price movements before a trend transition occurs, while lower multipliers make the indicator more responsive.
### 3. Trend Identification
MACE operates using two primary confirmed trend states:
**Bullish (Green)**
A bullish state is established when the closing price exceeds the upper ATR threshold.
The composite EMA and candles turn turquoise green, indicating that the indicator's trend conditions favour an upward market direction.
**Bearish (Red)**
A bearish state is established when the closing price falls below the lower ATR threshold.
The composite EMA and candles turn pink-red, indicating that the indicator's trend conditions favour a defensive or bearish interpretation.
Once established, the current state persists until the opposite threshold is crossed.
The indicator does not automatically generate short positions. The bearish state can instead be interpreted as a potential cash or risk-reduction condition, depending on the user's methodology.
### 4. RSI Mean-Reversion Module
MACE includes a separate RSI module intended to highlight potentially stretched downside price conditions.
By default, RSI uses a length of 33 periods and a lower threshold of 33.
When RSI crosses below the configured threshold on a confirmed candle, a purple **PROBABLE REVERSION** label appears beneath the price chart.
This identifies a potential mean-reversion setup following an oversold RSI reading.
The label is generated only when RSI first crosses below the threshold, rather than repeatedly appearing on every candle that remains oversold.
Importantly, the RSI module operates independently from the EMA consensus engine.
RSI readings do not influence the composite EMA, ATR thresholds, or bullish and bearish trend transitions.
An oversold RSI reading does not establish a statistically verified probability of reversal. Price may continue declining after the label appears.
## What Makes MACE Different?
MACE combines several complementary components into a single trend-visualisation framework.
Its main distinguishing features are:
- **Geometrically distributed EMA lengths:** Instead of selecting a handful of conventional moving-average periods, MACE constructs a configurable range of smoothing horizons.
- **Equal-weighted EMA aggregation:** The individual EMA values are combined into one composite line, providing a consolidated representation of multiple trend horizons.
- **Volatility-adjusted trend transitions:** ATR-based thresholds help distinguish minor movements around the composite from larger directional changes.
- **Persistent trend states:** The indicator maintains its previous trend direction while price remains within the ATR buffer, reducing repeated transitions around a single threshold.
- **Independent RSI reversion identification:** Potential oversold conditions can be observed alongside the prevailing trend without modifying the underlying trend logic.
- **Confirmed-close alerts:** Trend transitions and RSI threshold crossings are evaluated on confirmed candle closes.
The purpose of this combination is to consolidate trend identification, volatility filtering, and potential mean-reversion observations into one configurable chart overlay.
MACE does not claim to introduce a new mathematical moving-average method. Its implementation focuses on how established calculations are combined and presented for practical market analysis.
## Settings and Customisation
**EMA Consensus Engine**
- Number of EMAs: 50 by default
- Shortest EMA Length: 10
- Longest EMA Length: 300
Increasing the EMA length range generally increases the influence of longer-term price history. Shortening the range generally makes the composite more responsive.
**ATR Noise Filter**
- ATR Filter: Enabled by default
- ATR Length: 14
- ATR Multiplier: 1.0
The ATR filter can be disabled to generate trend transitions directly from price movements above or below the composite EMA.
**RSI Reversion**
- RSI Length: 33
- RSI Lower Bound: 30
- Probable Reversion Labels: Enabled by default
These settings control the independent RSI-based reversion labels.
**Visual Settings**
Users can enable or disable the composite EMA, trend-coloured candles, background shading, and ATR bands.
The indicator begins displaying its signals and visuals from 1 November 2017. Earlier available price history may still contribute to the initialisation of its calculations.
## Alerts
Three alert conditions are available:
**Valence MACE LONG:** Triggered when the indicator transitions into its confirmed bullish state.
**Valence MACE CASH:** Triggered when the indicator transitions from its bullish state into its bearish/cash state.
**Valence MACE Probable Reversion:** Triggered when RSI crosses below its configured lower threshold.
All three alert conditions use confirmed candle closes.
## Limitations and Considerations
MACE is a trend-following indicator and, like other moving-average-based approaches, can produce delayed signals following rapid market reversals.
The ATR filter is intended to reduce sensitivity to minor price fluctuations, but it cannot eliminate false signals. Increasing the ATR multiplier may reduce frequent transitions while introducing additional entry and exit delays.
Because the composite is constructed from historical prices, it remains a lagging indicator.
The composite EMA line can update while the current candle is forming. However, the trend state and alert conditions are confirmed only when the candle closes.
Results may vary considerably across assets, timeframes, volatility environments, and parameter configurations.
The indicator does not execute trades, incorporate transaction costs, or provide a historical strategy performance report.
Users should independently evaluate its behaviour before incorporating it into a trading or investment methodology.
## Credits
The Exponential Moving Average is an established exponential smoothing method.
Average True Range (ATR) and Relative Strength Index (RSI) were developed by J. Welles Wilder Jr. and introduced in *New Concepts in Technical Trading Systems* (1978).
MACE uses these established technical-analysis concepts within its composite trend and volatility-filtering framework.
## Conclusion
Valence MACE is designed to simplify the interpretation of multiple moving-average horizons by consolidating them into a single volatility-filtered trend indicator.
Its objective is to help users distinguish sustained directional conditions from smaller price fluctuations, while separately identifying potential oversold market conditions.
The indicator is provided as an open-source technical-analysis tool for research, education, and independent market evaluation.
Skrypt open-source
W zgodzie z duchem TradingView twórca tego skryptu udostępnił go jako open-source, aby użytkownicy mogli przejrzeć i zweryfikować jego działanie. Ukłony dla autora. Korzystanie jest bezpłatne, jednak ponowna publikacja kodu podlega naszym Zasadom serwisu.

Wyłączenie odpowiedzialności
Informacje i publikacje nie stanowią i nie powinny być traktowane jako porady finansowe, inwestycyjne, tradingowe ani jakiekolwiek inne rekomendacje dostarczane lub zatwierdzone przez TradingView. Więcej informacji znajduje się w Warunkach użytkowania.
Skrypt open-source
W zgodzie z duchem TradingView twórca tego skryptu udostępnił go jako open-source, aby użytkownicy mogli przejrzeć i zweryfikować jego działanie. Ukłony dla autora. Korzystanie jest bezpłatne, jednak ponowna publikacja kodu podlega naszym Zasadom serwisu.
Wyłączenie odpowiedzialności
Informacje i publikacje nie stanowią i nie powinny być traktowane jako porady finansowe, inwestycyjne, tradingowe ani jakiekolwiek inne rekomendacje dostarczane lub zatwierdzone przez TradingView. Więcej informacji znajduje się w Warunkach użytkowania.