Alpha MTF Trend Matrix [identityKa]
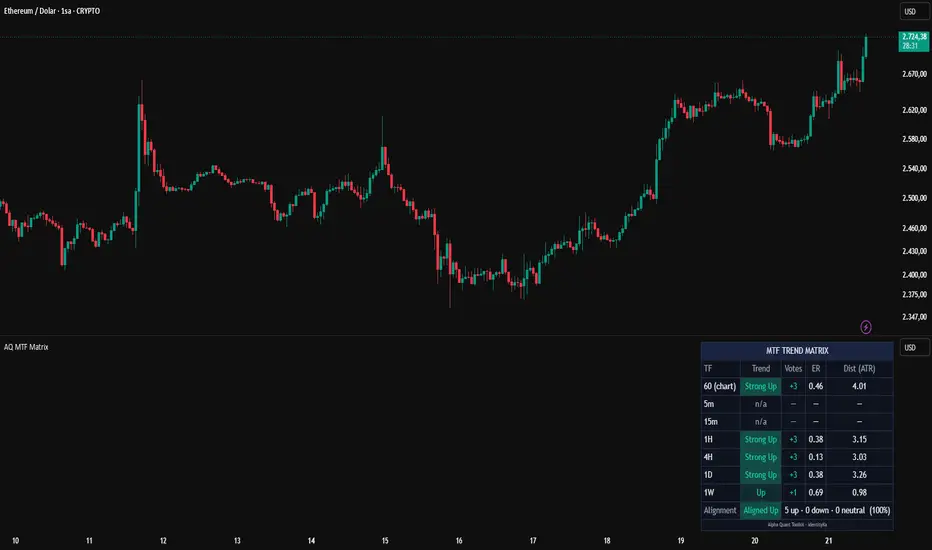
Alpha MTF Trend Matrix [identityKa]
Trend direction, strength and stretch across six timeframes, in one small table.
Most traders check higher timeframes by flipping charts back and forth. This tool puts them side by side and adds a single alignment reading, so you can see in a second whether the timeframes agree or fight each other.
HOW IT WORKS
Every timeframe is scored with the same three checks, each worth +1 (up), -1 (down) or 0:
1. Fast EMA versus slow EMA (default 20 and 50)
2. Close versus slow EMA
3. Slope of the slow EMA (rising or falling over the last few bars)
The sum is the timeframe's "Votes", from -3 to +3. +3 is labeled Strong Up, +1 and +2 Up, -1 and -2 Down, -3 Strong Down. A vote system was chosen over a single crossover because it separates a clean, agreed trend (all three checks agree) from a mixed or transitioning one.
Two extra columns give context for each row:
- ER: Efficiency Ratio, from 0 (choppy, going nowhere) to 1 (straight-line movement). It shows how clean the movement is, not just its direction.
- Dist (ATR): how far the close is from the slow EMA, measured in ATR. It shows how stretched the timeframe is.
ALIGNMENT
The last row combines all active timeframes into one number: the net share of timeframes pointing up minus down, from -100% to +100%. At or above the chosen threshold (default 70%) it reads Aligned Up, at or below the negative threshold it reads Aligned Down, otherwise Mixed. The counts of Up, Down and Neutral timeframes are shown next to it.
NO-REPAINT BY DEFAULT
Higher-timeframe rows use the last CLOSED bar of that timeframe, so they do not change after the fact and do not look ahead. You can switch this off to see the developing bar, but rows may then change until that bar closes. The chart's own row is always live.
WHAT YOU SEE
- A dashboard with six configurable timeframes plus your current chart timeframe
- Color-coded Trend cells, Votes, ER, and distance from the slow EMA
- One alignment row summarizing all timeframes
HOW TO USE IT
- Use it as a context filter: a setup that agrees with the higher timeframes is in a different environment from one fighting them.
- Watch the ER column. A timeframe that is Up but has a low ER is trending weakly.
- Watch Dist (ATR). A large positive or negative distance means that timeframe is already stretched from its slow average.
- Alignment is a description of agreement, not a prediction.
SETTINGS
- Calculation: fast and slow EMA length, slope lookback, ER length, confirmed-bars mode
- Timeframes: switch each of six rows on or off and pick any timeframe
- Alignment Rules: threshold for Aligned
- Display / Dashboard: colors, position, text size, footer
Timeframes lower than your chart timeframe are shown as n/a.
ALERTS
Timeframes aligned up, aligned down, alignment lost, alignment changed. For stable triggers, set the alert to Once Per Bar Close.
NOTES AND LIMITATIONS
- EMA-based trend measures lag by nature.
- In confirmed mode, higher-timeframe rows reflect the last closed bar, so they react one bar of that timeframe later. That is the price of not repainting.
- Only timeframes equal to or higher than the chart timeframe are supported.
This script is for educational and informational purposes only and is not financial advice. Past behavior does not guarantee future results.
Part of the Alpha Quant Toolkit by identityKa. See also: Alpha Regime Dashboard [identityKa], Alpha Adaptive Supertrend [identityKa].

Wyłączenie odpowiedzialności
Informacje i publikacje nie stanowią i nie powinny być traktowane jako porady finansowe, inwestycyjne, tradingowe ani jakiekolwiek inne rekomendacje dostarczane lub zatwierdzone przez TradingView. Więcej informacji znajduje się w Warunkach użytkowania.
Wyłączenie odpowiedzialności
Informacje i publikacje nie stanowią i nie powinny być traktowane jako porady finansowe, inwestycyjne, tradingowe ani jakiekolwiek inne rekomendacje dostarczane lub zatwierdzone przez TradingView. Więcej informacji znajduje się w Warunkach użytkowania.