First Strike ATR Compass
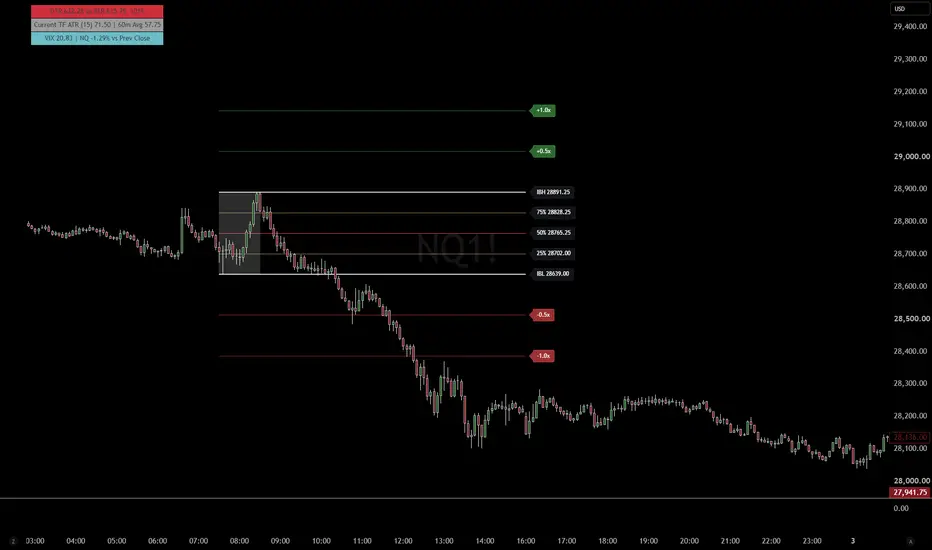
Hello everyone!
I've noticed more traders talking about ATR lately, so I thought I'd share something I've been working on.
For me personally, **ATR has always been one of the foundations of my trading plan**, whether I'm trading futures, options, or swing trades. Because it's such an important part of how I approach the markets, I created an indicator called the **First Strike ATR Compass**, and I figured it was time to share it with everyone.
I wanted to explain a little about how I use ATR and why I designed this indicator the way I did.
### How I Use ATR in My Trading
Most ATR indicators come with a default length of 14, meaning the calculation is based on the previous 14 candles.
I'm primarily a scalper, so my approach is to use higher timeframes for market context while executing trades on lower timeframes. I typically analyze the 1-hour, 15-minute, and 5-minute charts, but most of my actual trade executions happen on the 1- or 2-minute chart.
With that in mind, I set the default ATR length on this indicator to **15 periods** and compare the current ATR reading against its average over the previous 60 minutes.
My thinking is pretty simple: when those two values are relatively balanced, I generally view volatility as more stable and predictable. When they start separating significantly, it tells me market conditions may be changing, and I need to adjust my approach.
### Understanding the DTR vs. Daily ATR
At the top of the indicator, you'll see **DTR (Daily Trading Range) vs. Daily ATR (Average True Range)**.
This is one of the most important pieces of information I look at when preparing for the New York trading session.
I've built a simple color-coded system around how much of the daily ATR has already been used.
**🟡 Yellow — Below 50% of Daily ATR**
If the DTR is below 50% of the Daily ATR heading into the NY open, the indicator will be shaded yellow.
For me, this suggests the market has experienced relatively limited price expansion leading into the opening bell. It doesn't necessarily mean the market won't move, but it does tell me to be a little more patient.
When I see yellow, I typically wait at least 15 minutes after the opening bell before reassessing the DTR and deciding how aggressively I want to trade.
**🟢 Green — 50% to 95% of Daily ATR**
When the DTR reaches 50% of the Daily ATR, the indicator turns green and remains green through 95%.
This is generally the environment where I'm more comfortable following my normal trading plan, assuming my other setups and confirmations are present.
For me, it suggests the market has already demonstrated some meaningful price expansion, which can help provide context for potential continuation moves.
**🔴 Red — Above 95% of Daily ATR**
Once the DTR exceeds 95% of the Daily ATR, the indicator turns red.
This is where I start becoming more cautious.
It tells me the market has already traveled approximately its average daily range. That doesn't mean price can't continue moving in the same direction, but I become more aware of the possibility of consolidation, choppy price action, or a reversal.
At this point, I may become more selective with entries, adjust my expectations, or simply wait for a better opportunity.
### A Few Final Thoughts
One thing I want to emphasize is that **ATR doesn't tell me which direction the market is going to move. It helps me understand the environment I'm trading in.**
I don't use this indicator as a standalone buy or sell signal. It's simply another tool that helps me evaluate market conditions, manage expectations, and determine when I should be aggressive or patient.
The indicator also displays the current VIX reading and NQ's percentage change from the previous trading day's close, giving me a little additional market context without cluttering up my charts.
While the ATR calculations can be used on different timeframes, **the way I've calibrated and interpreted this indicator is specifically intended for NQ trading during the New York session.** I wouldn't automatically apply the same thresholds to other instruments or trading sessions without making adjustments.
Everyone has a different trading style, and what works for me may not work for someone else. Feel free to use the indicator, experiment with the settings, and adjust the calculations to fit your own trading plan.
I just figured that since ATR has played such an important role in my trading over the years, it was time to share something I've built around it.
**Trade safe, everyone!**
I've noticed more traders talking about ATR lately, so I thought I'd share something I've been working on.
For me personally, **ATR has always been one of the foundations of my trading plan**, whether I'm trading futures, options, or swing trades. Because it's such an important part of how I approach the markets, I created an indicator called the **First Strike ATR Compass**, and I figured it was time to share it with everyone.
I wanted to explain a little about how I use ATR and why I designed this indicator the way I did.
### How I Use ATR in My Trading
Most ATR indicators come with a default length of 14, meaning the calculation is based on the previous 14 candles.
I'm primarily a scalper, so my approach is to use higher timeframes for market context while executing trades on lower timeframes. I typically analyze the 1-hour, 15-minute, and 5-minute charts, but most of my actual trade executions happen on the 1- or 2-minute chart.
With that in mind, I set the default ATR length on this indicator to **15 periods** and compare the current ATR reading against its average over the previous 60 minutes.
My thinking is pretty simple: when those two values are relatively balanced, I generally view volatility as more stable and predictable. When they start separating significantly, it tells me market conditions may be changing, and I need to adjust my approach.
### Understanding the DTR vs. Daily ATR
At the top of the indicator, you'll see **DTR (Daily Trading Range) vs. Daily ATR (Average True Range)**.
This is one of the most important pieces of information I look at when preparing for the New York trading session.
I've built a simple color-coded system around how much of the daily ATR has already been used.
**🟡 Yellow — Below 50% of Daily ATR**
If the DTR is below 50% of the Daily ATR heading into the NY open, the indicator will be shaded yellow.
For me, this suggests the market has experienced relatively limited price expansion leading into the opening bell. It doesn't necessarily mean the market won't move, but it does tell me to be a little more patient.
When I see yellow, I typically wait at least 15 minutes after the opening bell before reassessing the DTR and deciding how aggressively I want to trade.
**🟢 Green — 50% to 95% of Daily ATR**
When the DTR reaches 50% of the Daily ATR, the indicator turns green and remains green through 95%.
This is generally the environment where I'm more comfortable following my normal trading plan, assuming my other setups and confirmations are present.
For me, it suggests the market has already demonstrated some meaningful price expansion, which can help provide context for potential continuation moves.
**🔴 Red — Above 95% of Daily ATR**
Once the DTR exceeds 95% of the Daily ATR, the indicator turns red.
This is where I start becoming more cautious.
It tells me the market has already traveled approximately its average daily range. That doesn't mean price can't continue moving in the same direction, but I become more aware of the possibility of consolidation, choppy price action, or a reversal.
At this point, I may become more selective with entries, adjust my expectations, or simply wait for a better opportunity.
### A Few Final Thoughts
One thing I want to emphasize is that **ATR doesn't tell me which direction the market is going to move. It helps me understand the environment I'm trading in.**
I don't use this indicator as a standalone buy or sell signal. It's simply another tool that helps me evaluate market conditions, manage expectations, and determine when I should be aggressive or patient.
The indicator also displays the current VIX reading and NQ's percentage change from the previous trading day's close, giving me a little additional market context without cluttering up my charts.
While the ATR calculations can be used on different timeframes, **the way I've calibrated and interpreted this indicator is specifically intended for NQ trading during the New York session.** I wouldn't automatically apply the same thresholds to other instruments or trading sessions without making adjustments.
Everyone has a different trading style, and what works for me may not work for someone else. Feel free to use the indicator, experiment with the settings, and adjust the calculations to fit your own trading plan.
I just figured that since ATR has played such an important role in my trading over the years, it was time to share something I've built around it.
**Trade safe, everyone!**

Wyłączenie odpowiedzialności
Informacje i publikacje nie stanowią i nie powinny być traktowane jako porady finansowe, inwestycyjne, tradingowe ani jakiekolwiek inne rekomendacje dostarczane lub zatwierdzone przez TradingView. Więcej informacji znajduje się w Warunkach użytkowania.
Wyłączenie odpowiedzialności
Informacje i publikacje nie stanowią i nie powinny być traktowane jako porady finansowe, inwestycyjne, tradingowe ani jakiekolwiek inne rekomendacje dostarczane lub zatwierdzone przez TradingView. Więcej informacji znajduje się w Warunkach użytkowania.