Zaktualizowano
Smart Buy Sell Indicator V1
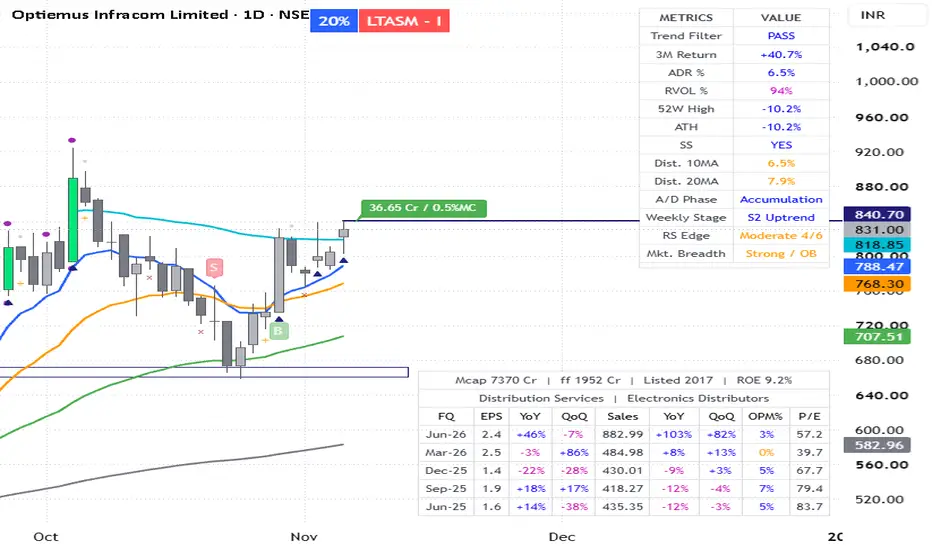
This indicator is designed to identify **potential trend reversals and momentum-based trading opportunities** using a combination of **two EMAs and RSI**.
#### 📊 Indicators Used
Fast EMA (Default: 9 EMA): Tracks short-term price movement.
Slow EMA (Default: 21 EMA): Identifies the broader short-term trend.
RSI (Default: 14): Confirms the strength and momentum of the move.
### 🟢 BUY Signal
A BUY signal is generated when:
The 9 EMA crosses above the 21 EMA, indicating a possible upward trend reversal.
RSI is 50 or above, confirming positive momentum.
How to use: Consider the BUY signal as an indication of bullish momentum. It can be used for a fresh entry or to identify a possible continuation of an upward move.
### 🔴 SELL Signal
A SELL signal is generated when:
The 9 EMA crosses below the 21 EMA, indicating a possible downward trend reversal.
RSI is 50 or below, confirming negative momentum.
How to use: Consider the SELL signal as an indication of weakening momentum or a potential bearish trend. It can be used to exit a long position or, depending on your trading strategy, identify a potential short-selling opportunity.
### ⚠️ Important Usage Tips
* Best used on **liquid stocks and indices.
* The indicator works better when the market is trending.
* Avoid relying solely on signals during **sideways or highly volatile markets**, where EMA crossovers may generate false signals.
* Always consider **support/resistance, price action, volume and the overall market trend** before taking a trade.
* Use an appropriate **stop-loss**, preferably based on the recent swing low for BUY trades and recent swing high for SELL trades.
### In Simple Terms
>EMA crossover identifies the change in trend, while RSI confirms whether momentum supports that direction.
This makes the indicator useful for traders looking for simple, rule-based BUY and SELL signals rather than relying on EMA crossovers alone.
#### 📊 Indicators Used
Fast EMA (Default: 9 EMA): Tracks short-term price movement.
Slow EMA (Default: 21 EMA): Identifies the broader short-term trend.
RSI (Default: 14): Confirms the strength and momentum of the move.
### 🟢 BUY Signal
A BUY signal is generated when:
The 9 EMA crosses above the 21 EMA, indicating a possible upward trend reversal.
RSI is 50 or above, confirming positive momentum.
How to use: Consider the BUY signal as an indication of bullish momentum. It can be used for a fresh entry or to identify a possible continuation of an upward move.
### 🔴 SELL Signal
A SELL signal is generated when:
The 9 EMA crosses below the 21 EMA, indicating a possible downward trend reversal.
RSI is 50 or below, confirming negative momentum.
How to use: Consider the SELL signal as an indication of weakening momentum or a potential bearish trend. It can be used to exit a long position or, depending on your trading strategy, identify a potential short-selling opportunity.
### ⚠️ Important Usage Tips
* Best used on **liquid stocks and indices.
* The indicator works better when the market is trending.
* Avoid relying solely on signals during **sideways or highly volatile markets**, where EMA crossovers may generate false signals.
* Always consider **support/resistance, price action, volume and the overall market trend** before taking a trade.
* Use an appropriate **stop-loss**, preferably based on the recent swing low for BUY trades and recent swing high for SELL trades.
### In Simple Terms
>EMA crossover identifies the change in trend, while RSI confirms whether momentum supports that direction.
This makes the indicator useful for traders looking for simple, rule-based BUY and SELL signals rather than relying on EMA crossovers alone.
Informacje o Wersji
### Briefing about the Add-onsThe updated **Smart Buy Sell Indicator V1** now includes the following additional features:
#### 1. EMA / SMA Selection
You can select either:
EMA – Exponential Moving Average
SMA – Simple Moving Average
The selected type is applied to the **Fast MA, Slow MA, 50 MA and 200 MA.
---
#### 2. 50 MA – Trend Reference
The indicator now includes a 50-period Moving Average.
* Can be individually turned ON/OFF
* Helps identify the medium-term trend
* Price above 50 MA generally indicates stronger medium-term momentum
* Price below 50 MA may indicate weakness
---
#### 3. 200 MA – Long-Term Trend Reference
A 200-period Moving Average has also been added.
* Can be individually turned ON/OFF
* Helps identify the broader long-term trend
* Price above 200 MA generally indicates a stronger long-term structure
* Price below 200 MA can indicate a weaker long-term structure
Note:The 50 MA and 200 MA are only for trend analysis and **do not affect BUY or SELL signals.
---
### 4. 52-Week High %
The dashboard shows how far the current price is from its 52-week high.
Example:
-11.8%
This means the current price is approximately 11.8% below its 52-week high.
0% means the stock is currently at its 52-week high.
This is useful for identifying stocks trading close to their recent highs.
---
### 5. ATH % (All-Time High)
The dashboard also shows the percentage distance from the stock's All-Time High.
Example:
-20%
This means the current price is 20% below its recorded ATH.
0% means the stock is trading at its ATH.
This helps identify how close a stock is to its historical peak.
---
### 6. ADR % – Average Daily Range
ADR % measures the stock's average daily price movement.
Higher ADR generally indicates:
* Higher volatility
* Larger potential daily moves
Lower ADR generally indicates:
* Lower volatility
* Smaller daily price movement
---
### 7. RVOL % – Relative Volume
RVOL compares the current volume with its average volume.
Example:
RVOL 200% means the current volume is approximately twice the average volume
Higher RVOL can help confirm:
* Breakouts
* Strong momentum
* Institutional participation
---
### 8. Avg TO. – Average Turnover
Avg TO. represents the average traded value of the stock, displayed in Crores.
Example:
₹66.8 Cr
Higher average turnover generally indicates better liquidity and greater market participation.
---
### Overall Usage
The indicator can now be used as a combination of:
Entry/Exit Signals + Trend Analysis + Volume Confirmation + Liquidity Analysis + High Proximity Analysis
The Fast/Slow MA crossover with RSI confirmation remains responsible for generating BUY and SELL signals, while the 50/200 MA and dashboard metrics provide additional confirmation and context.
Informacje o Wersji
### 🟣 Purple Dot — BriefA purple dot below the candle indicates that the stock is showing strong upward momentum along with high trading volume.
The dot appears only when both conditions are met simultaneously:
Volume is 5,00,000 or more (customizable), and
Price has risen by 5% or more compared with the previous candle's close (customizable).
### How to use it
The purple dot is a momentum alert, not an independent BUY signal. It can be useful for spotting:
* Strong momentum stocks
* High-volume breakouts
* Potential swing opportunities
* Stocks worth monitoring for follow-through
It becomes a stronger confirmation when combined with your BUY signal, 50 MA/200 MA trend, and a breakout near important levels such as the 52-week high or ATH.
Informacje o Wersji
Bug fixedInformacje o Wersji
Bug fixedInformacje o Wersji
## New Add-ons### 🟠 NR7 `ˣ`
* Smallest candle range among the last 7 candles.
* Shows a tiny orange **`ˣ` below the candle.
* Indicates strong volatility contraction** and a possible upcoming breakout.
### 🟠 NR5 `⁺`
* Smallest candle range among the last 5 candles.
* Shows a tiny orange `⁺` below the candle.
* Indicates volatility contraction, but NR7 is generally stronger.
### 📊 Dashboard Size
You can now select:
Tiny | Small | Normal
This changes the dashboard text size according to your preference.
### Quick Use
NR7/NR5 → Wait for breakout → Confirm with trend and volume.
`ˣ` = NR7 (stronger)
`⁺` = NR5 (more frequent)
Informacje o Wersji
Updated the Strong start componentInformacje o Wersji
Minor bug fixedInformacje o Wersji
Minor bug fixedInformacje o Wersji
## SVRO — Updated ConceptSVRO is a trading setup concept credited to Manas Arora, customized and automated in the indicator.
SVRO combines four confirmations:
### S — Strong Start
The stock should show strength in the early part of the trading session.
### V — Value Area High
Price should be trading above the Previous Day's Value Area High (VAH), indicating strength above an important volume-profile level.
### R — Relative Volume
The stock should show the required volume participation compared with its normal average volume.
### O — Opening Range Breakout
Price should break above the Opening Range.
---
## SVRO BUY Trigger
A BUY signal is generated only when all four conditions are satisfied:
Strong Start
+
Above Previous Day VAH
+
Relative Volume Confirmation
+
Opening Range Breakout
↓
SVRO BUY
## Updated Timeframe Feature
You can now select the SVRO Signal Timeframe:
### 🟢 5-Minute SVRO
All SVRO conditions are evaluated using the 5-minute setup.
SVRO Timeframe = 5 Minutes
Opening Range = First 5 Minutes
This provides an earlier and faster BUY trigger.
### 🟢 15-Minute SVRO
All SVRO conditions are evaluated using the 15-minute setup.
SVRO Timeframe = 15 Minutes
Opening Range = First 15 Minutes
This provides a slower and more conservative confirmation.
## Important: 5M and 15M Signals Are Independent
A 5-minute SVRO BUY does not automatically mean a 15-minute SVRO BUY will trigger.
Each timeframe evaluates the setup independently.
5M SVRO BUY ≠ Automatic 15M SVRO BUY
For example:
5M SVRO → BUY 🟢
15M SVRO → NO 🔴
is possible.
---
## Dashboard Behaviour
When the selected SVRO timeframe generates a valid BUY:
* On the selected intraday timeframe → SVRO = BUY
* On the Daily chart → SVRO = BUY 5M or BUY 15M, depending on the selected SVRO timeframe.
The standalone SS row has been removed from the dashboard, since Strong Start is already included as the S condition inside SVRO.
Informacje o Wersji
### Brief about the current add-ons* Trend Filter – Checks whether the stock meets the selected trend criteria.
* Prior Uptrend – Shows whether the stock had a meaningful uptrend before the current setup.
* ADR % – Displays the stock's Average Daily Range percentage.
* RVOL % – Shows current volume strength compared with its average volume.
* 52W High – Indicates how close the stock is to its 52-week high.
* ATH – Indicates the stock's position relative to its All-Time High.
* Avg TO. – Shows average turnover/liquidity.
* PP – Indicates whether the price meets the Pocket Pivot condition.
* SS (Strong Start)** – Now requires:
* Positive opening above the previous close
* Low holding above 99.5% of the previous close
* First 5-minute volume ≥ the selected threshold (default 10% of average daily volume)
* Price crosses the **previous day's high
* Mkt. Breadth – Shows the breadth condition of the user-selected market index.
ORB and SVRO have been completely removed.
Informacje o Wersji
Minor correction done to SS. working fine nowInformacje o Wersji
Upgraded the Market breadth logicInformacje o Wersji
Added Vwap as an optional indicator for intraday trading.Informacje o Wersji
Improved Market breadth feature
Wyłączenie odpowiedzialności
Informacje i publikacje nie stanowią i nie powinny być traktowane jako porady finansowe, inwestycyjne, tradingowe ani jakiekolwiek inne rekomendacje dostarczane lub zatwierdzone przez TradingView. Więcej informacji znajduje się w Warunkach użytkowania.
Wyłączenie odpowiedzialności
Informacje i publikacje nie stanowią i nie powinny być traktowane jako porady finansowe, inwestycyjne, tradingowe ani jakiekolwiek inne rekomendacje dostarczane lub zatwierdzone przez TradingView. Więcej informacji znajduje się w Warunkach użytkowania.