OPEN-SOURCE SCRIPT
Heatmap VWAP Profile [ChartPrime]
🔶 OVERVIEW
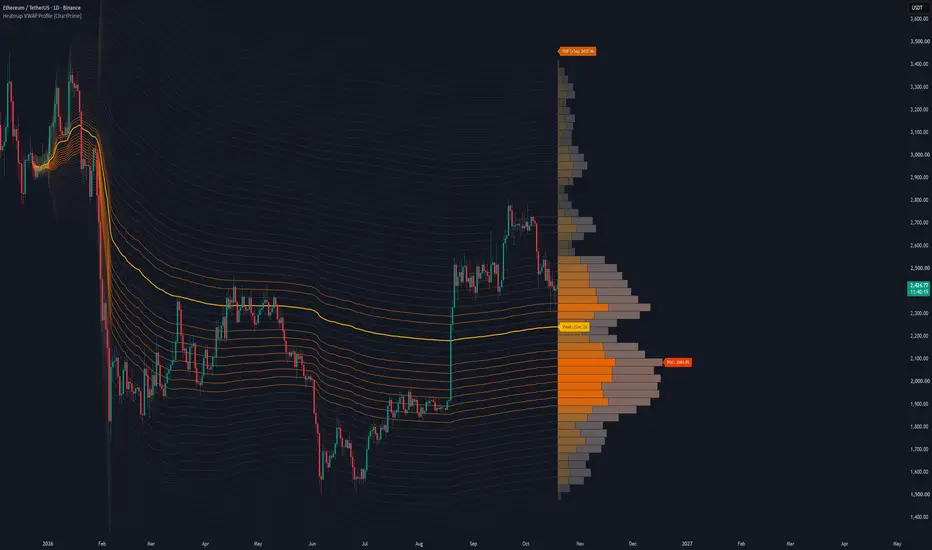
The Heatmap VWAP Profile [ChartPrime] indicator merges anchored Volume Weighted Average Price (VWAP) bands with an advanced heatmap volume profile. By projecting standard deviation channels forward from a user-defined anchor point and filling them with volume-weighted color gradients, it helps you visualize high-volume nodes (HVNs), low-volume nodes (LVNs), and the Point of Control (POC) directly on your chart.
🔶 HOW IT WORKS
The indicator operates through a multi-step analytical engine:
🔶 KEY FEATURES
🔶 TRADING APPLICATIONS
🔶 SETTINGS
🔶 CONCLUSION
The Heatmap VWAP Profile [ChartPrime] brings institutional order-flow visualization to your workspace. By combining anchored VWAP geometry with dynamic volume heatmaps, it gives you a clear visual edge in locating structural liquidity.
The Heatmap VWAP Profile [ChartPrime] indicator merges anchored Volume Weighted Average Price (VWAP) bands with an advanced heatmap volume profile. By projecting standard deviation channels forward from a user-defined anchor point and filling them with volume-weighted color gradients, it helps you visualize high-volume nodes (HVNs), low-volume nodes (LVNs), and the Point of Control (POC) directly on your chart.
🔶 HOW IT WORKS
The indicator operates through a multi-step analytical engine:
- Anchored VWAP Engine: Calculates cumulative price-volume action and standard deviation spread starting from a configurable lookback anchor bar.
- Dynamic Polyline Bands: Projects upper and lower standard deviation channels forward across the historical chart range.
- Volume Profile Binning: Maps up-volume and down-volume distribution across custom price rows between the outer deviation boundaries.
- Heatmap Gradient Transparency: Applies dynamic opacity and color palettes based on volume density to highlight key institutional trading zones.
🔶 KEY FEATURES
- Interactive Volume Profile Boxes: Renders side-by-side up and down volume nodes scaled to match active liquidity distribution.
- Heatmap Polylines: Connects standard deviation bands with gradient coloring and varying styles depending on volume magnitude.
- Point of Control (POC) Tracking: Automatically identifies and labels the exact price row holding the highest volume concentration.
- Custom Label Styling: Displays dedicated price tags for VWAP, the POC, and the upper/lower deviation boundaries.
🔶 TRADING APPLICATIONS
- Support & Resistance Mapping: Use high-volume nodes and the POC as natural magnet levels for price reversals or range boundaries.
- Volume Imbalance Detection: Look for low-volume nodes (LVNs) to identify areas where price may move rapidly due to a lack of resting liquidity.
- VWAP Trend Confluence: Gauge overall market bias and volatility expansion using the anchored VWAP baseline and its outer standard deviation bands.
🔶 SETTINGS
- Anchor & Band Settings: Controls lookback bar depth, polyline visibility, and the maximum standard deviation multiplier.
- Volume Profile Settings: Adjusts row counts and maximum profile width dimensions on the chart.
- Label Settings: Toggles price tag visibility and customizes label background and text colors.
- Color & Opacity Controls: Customizes the gold-and-bronze color palettes alongside transparency thresholds for high and low volume nodes.
🔶 CONCLUSION
The Heatmap VWAP Profile [ChartPrime] brings institutional order-flow visualization to your workspace. By combining anchored VWAP geometry with dynamic volume heatmaps, it gives you a clear visual edge in locating structural liquidity.
Skrypt open-source
W zgodzie z duchem TradingView twórca tego skryptu udostępnił go jako open-source, aby użytkownicy mogli przejrzeć i zweryfikować jego działanie. Ukłony dla autora. Korzystanie jest bezpłatne, jednak ponowna publikacja kodu podlega naszym Zasadom serwisu.

Wyłączenie odpowiedzialności
Informacje i publikacje nie stanowią i nie powinny być traktowane jako porady finansowe, inwestycyjne, tradingowe ani jakiekolwiek inne rekomendacje dostarczane lub zatwierdzone przez TradingView. Więcej informacji znajduje się w Warunkach użytkowania.
Skrypt open-source
W zgodzie z duchem TradingView twórca tego skryptu udostępnił go jako open-source, aby użytkownicy mogli przejrzeć i zweryfikować jego działanie. Ukłony dla autora. Korzystanie jest bezpłatne, jednak ponowna publikacja kodu podlega naszym Zasadom serwisu.
Wyłączenie odpowiedzialności
Informacje i publikacje nie stanowią i nie powinny być traktowane jako porady finansowe, inwestycyjne, tradingowe ani jakiekolwiek inne rekomendacje dostarczane lub zatwierdzone przez TradingView. Więcej informacji znajduje się w Warunkach użytkowania.