Marci Silfran (Full-Day Trendlines & Multi-Timeframe Matrix)
Indicator Description - Trendline & Distance A Geometry
Overview
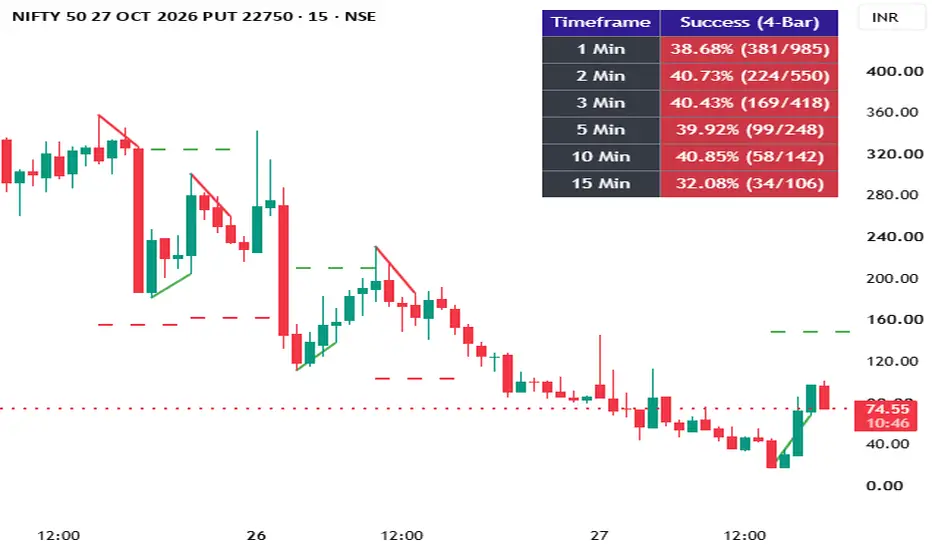
`Marci Silfran` is an advanced technical analysis indicator designed to project dynamic Support and Resistance target lines based on precise candlestick wick geometry and multi-timeframe performance tracking.
Core Logic & Formula
1. Trendline Construction: Automatically identifies valid swing anchor points across a user-defined lookback window (2 to 8 candles) and plots a trendline connecting the anchor wicks to the current candle.
2. Distance A Measurement: Scans the intermediate candles within the lookback span to locate the extreme wick (lowest wick in a downtrend, highest wick in an uptrend) that extends beyond the baseline trendline. It calculates the vertical distance (Distance A) between the trendline and that extreme wick.
3. Parallel Projection: Projects Distance A in parallel from the anchor structure to plot a non-floating, highly accurate dashed support or resistance target line.
Features
Configurable Lookback: Easily adjust the candle lookback window (`[2, 3, 4, 5, 6, 8]`) directly from the input settings.
Multi-Timeframe Matrix Table: Displays a real-time performance tracking table on your chart showing signal counts and success rates across 1-minute, 2-minute, 3-minute, 5-minute, 10-minute, and 15-minute timeframes.
Clean Visuals: Fully customized color options for uptrends and downtrends with zero floating artifacts.
Overview
`Marci Silfran` is an advanced technical analysis indicator designed to project dynamic Support and Resistance target lines based on precise candlestick wick geometry and multi-timeframe performance tracking.
Core Logic & Formula
1. Trendline Construction: Automatically identifies valid swing anchor points across a user-defined lookback window (2 to 8 candles) and plots a trendline connecting the anchor wicks to the current candle.
2. Distance A Measurement: Scans the intermediate candles within the lookback span to locate the extreme wick (lowest wick in a downtrend, highest wick in an uptrend) that extends beyond the baseline trendline. It calculates the vertical distance (Distance A) between the trendline and that extreme wick.
3. Parallel Projection: Projects Distance A in parallel from the anchor structure to plot a non-floating, highly accurate dashed support or resistance target line.
Features
Configurable Lookback: Easily adjust the candle lookback window (`[2, 3, 4, 5, 6, 8]`) directly from the input settings.
Multi-Timeframe Matrix Table: Displays a real-time performance tracking table on your chart showing signal counts and success rates across 1-minute, 2-minute, 3-minute, 5-minute, 10-minute, and 15-minute timeframes.
Clean Visuals: Fully customized color options for uptrends and downtrends with zero floating artifacts.

Wyłączenie odpowiedzialności
Informacje i publikacje nie stanowią i nie powinny być traktowane jako porady finansowe, inwestycyjne, tradingowe ani jakiekolwiek inne rekomendacje dostarczane lub zatwierdzone przez TradingView. Więcej informacji znajduje się w Warunkach użytkowania.
Wyłączenie odpowiedzialności
Informacje i publikacje nie stanowią i nie powinny być traktowane jako porady finansowe, inwestycyjne, tradingowe ani jakiekolwiek inne rekomendacje dostarczane lub zatwierdzone przez TradingView. Więcej informacji znajduje się w Warunkach użytkowania.