Supertrend Breakout Graded MTF
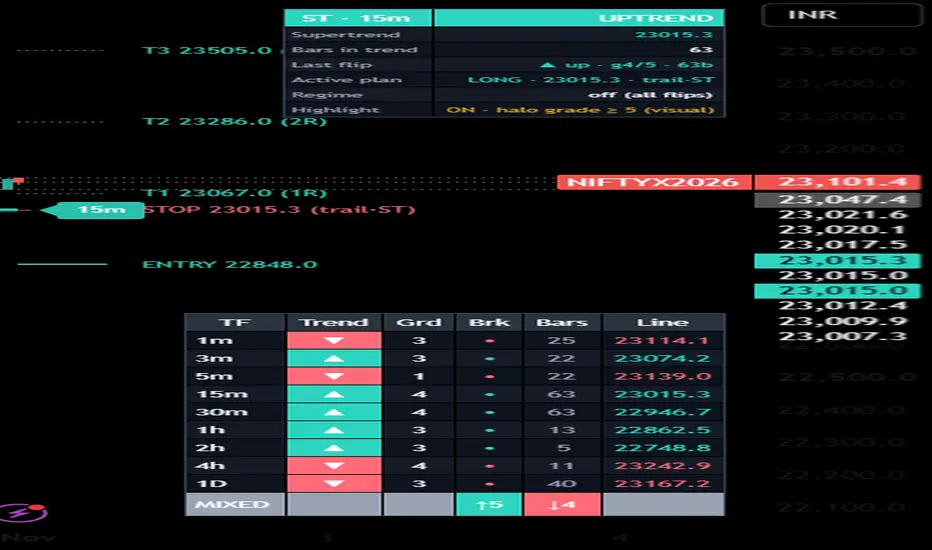
Supertrend Breakout — Graded, Regime-Gated, Edge-Measured (MTF)
The Supertrend read as a breakout engine, with an honesty layer bolted on. Instead of plotting a flip and implying it's a buy/sell, this engine forward-tests its own flips and shows you — on the chart — where the Supertrend breakout actually pays and where it doesn't.
WHAT IT IS
The Supertrend ATR band sits below price in an uptrend, above it in a downtrend, and flips when price closes through it. That flip is the BREAK. Each flip is graded 0-5 on how decisive the breaking bar was, can be gated to trending conditions, and carries a dynamic entry / stop / target plan whose trailing stop is the Supertrend line itself. Default factor 3.0, ATR 10 (classic); every input is adjustable.
THE MEASUREMENT (why this is not just another Supertrend)
Every armed flip is forward-resolved past-only, scored in R per grade, as a Wilson-floored win-rate and net R after costs, beside two baselines:
- A RANDOM-DIRECTION NULL: the same bars and the same exit, but a coin-flip direction. If a flip doesn't beat the null, its "edge" is just drift and payoff geometry.
- A FADE: the opposite trade. If fading earns more, the signal is better inverted.
A flip only earns trust when it beats the null AND clears zero after costs.
WHAT THE MEASUREMENT REVEALS — AND THE CHART SHOWS IT
Across timeframes, intraday breakouts (roughly 1-5m) lose and are beaten by the null — they get whipsawed, and fading pays more. From about 30m up the breakout beats the null, and it turns net-positive on 1h, 4h and the daily, with the daily the strongest. So the Supertrend breakout is a HIGHER-TIMEFRAME, with-trend read — not an intraday scalp. The 0-5 grade rates how decisive the flip bar looked but does not reliably predict the outcome, so treat it as context, not a quality score. Read the table on your own market and timeframe before trusting a setup.
MULTI-TIMEFRAME ON ONE CHART
Beyond the 9-timeframe alignment table (trend, fresh flip, grade and line level on 1m / 3m / 5m / 15m / 30m / 1h / 2h / 4h / 1D), the "Extra timeframe supertrends" group has six tick-boxes: tick any of them and that timeframe's Supertrend line is drawn on your current chart, coloured by its own trend (green up / red down) and tagged with its timeframe. Stack several at once to see where each timeframe's trend flips — all from one instance, no external indicators needed.
ALSO INCLUDED
- A regime gate: Kaufman efficiency ratio and/or higher-TF alignment, so flips arm only in a trend.
- A dynamic trade plan: trailing stop (the Supertrend line or a wider ATR trail), with R- or ATR-based targets.
- A trend ribbon, and EXP_* data-window outputs (stop, direction, graded break, alignment) for multi-indicator setups.
HOW TO USE
Add it to a chart, ideally a higher timeframe. Keep the flips that pass the strength filter and the regime gate. Open the measured-edge table (research toggle) and read the ALL row against the NULL row; switch the exit model and watch which one turns the entry edge into a positive net R. Let the table accumulate enough resolved flips before leaning on any number.
LIMITATIONS
All measured statistics are IN-SAMPLE on the current chart's own history — context and a transparency tool, NOT a backtest, a forecast, or a promise of future performance. Flips confirm on bar close; higher-timeframe values use closed bars only (no look-ahead). Research and education only; not investment advice.
CONCEPTS USED (operationalised here, not third-party code): Supertrend ATR bands (Olivier Seban / Welles Wilder), the Chandelier exit (Chuck LeBeau), the efficiency ratio (Perry Kaufman), triple-barrier labelling (in the spirit of Marcos Lopez de Prado), and the Wilson score interval. The grading, regime gate, 9-timeframe tally, ribbon, per-grade edge measurement and the multi-TF overlay are this script's own synthesis.
The Supertrend read as a breakout engine, with an honesty layer bolted on. Instead of plotting a flip and implying it's a buy/sell, this engine forward-tests its own flips and shows you — on the chart — where the Supertrend breakout actually pays and where it doesn't.
WHAT IT IS
The Supertrend ATR band sits below price in an uptrend, above it in a downtrend, and flips when price closes through it. That flip is the BREAK. Each flip is graded 0-5 on how decisive the breaking bar was, can be gated to trending conditions, and carries a dynamic entry / stop / target plan whose trailing stop is the Supertrend line itself. Default factor 3.0, ATR 10 (classic); every input is adjustable.
THE MEASUREMENT (why this is not just another Supertrend)
Every armed flip is forward-resolved past-only, scored in R per grade, as a Wilson-floored win-rate and net R after costs, beside two baselines:
- A RANDOM-DIRECTION NULL: the same bars and the same exit, but a coin-flip direction. If a flip doesn't beat the null, its "edge" is just drift and payoff geometry.
- A FADE: the opposite trade. If fading earns more, the signal is better inverted.
A flip only earns trust when it beats the null AND clears zero after costs.
WHAT THE MEASUREMENT REVEALS — AND THE CHART SHOWS IT
Across timeframes, intraday breakouts (roughly 1-5m) lose and are beaten by the null — they get whipsawed, and fading pays more. From about 30m up the breakout beats the null, and it turns net-positive on 1h, 4h and the daily, with the daily the strongest. So the Supertrend breakout is a HIGHER-TIMEFRAME, with-trend read — not an intraday scalp. The 0-5 grade rates how decisive the flip bar looked but does not reliably predict the outcome, so treat it as context, not a quality score. Read the table on your own market and timeframe before trusting a setup.
MULTI-TIMEFRAME ON ONE CHART
Beyond the 9-timeframe alignment table (trend, fresh flip, grade and line level on 1m / 3m / 5m / 15m / 30m / 1h / 2h / 4h / 1D), the "Extra timeframe supertrends" group has six tick-boxes: tick any of them and that timeframe's Supertrend line is drawn on your current chart, coloured by its own trend (green up / red down) and tagged with its timeframe. Stack several at once to see where each timeframe's trend flips — all from one instance, no external indicators needed.
ALSO INCLUDED
- A regime gate: Kaufman efficiency ratio and/or higher-TF alignment, so flips arm only in a trend.
- A dynamic trade plan: trailing stop (the Supertrend line or a wider ATR trail), with R- or ATR-based targets.
- A trend ribbon, and EXP_* data-window outputs (stop, direction, graded break, alignment) for multi-indicator setups.
HOW TO USE
Add it to a chart, ideally a higher timeframe. Keep the flips that pass the strength filter and the regime gate. Open the measured-edge table (research toggle) and read the ALL row against the NULL row; switch the exit model and watch which one turns the entry edge into a positive net R. Let the table accumulate enough resolved flips before leaning on any number.
LIMITATIONS
All measured statistics are IN-SAMPLE on the current chart's own history — context and a transparency tool, NOT a backtest, a forecast, or a promise of future performance. Flips confirm on bar close; higher-timeframe values use closed bars only (no look-ahead). Research and education only; not investment advice.
CONCEPTS USED (operationalised here, not third-party code): Supertrend ATR bands (Olivier Seban / Welles Wilder), the Chandelier exit (Chuck LeBeau), the efficiency ratio (Perry Kaufman), triple-barrier labelling (in the spirit of Marcos Lopez de Prado), and the Wilson score interval. The grading, regime gate, 9-timeframe tally, ribbon, per-grade edge measurement and the multi-TF overlay are this script's own synthesis.

Wyłączenie odpowiedzialności
Informacje i publikacje nie stanowią i nie powinny być traktowane jako porady finansowe, inwestycyjne, tradingowe ani jakiekolwiek inne rekomendacje dostarczane lub zatwierdzone przez TradingView. Więcej informacji znajduje się w Warunkach użytkowania.
Wyłączenie odpowiedzialności
Informacje i publikacje nie stanowią i nie powinny być traktowane jako porady finansowe, inwestycyjne, tradingowe ani jakiekolwiek inne rekomendacje dostarczane lub zatwierdzone przez TradingView. Więcej informacji znajduje się w Warunkach użytkowania.