OPEN-SOURCE SCRIPT
Zaktualizowano Dynamic ICT 2022 Model & Adaptive Structure PRO
Dynamic ICT 2022 Model & Adaptive Structure PRO
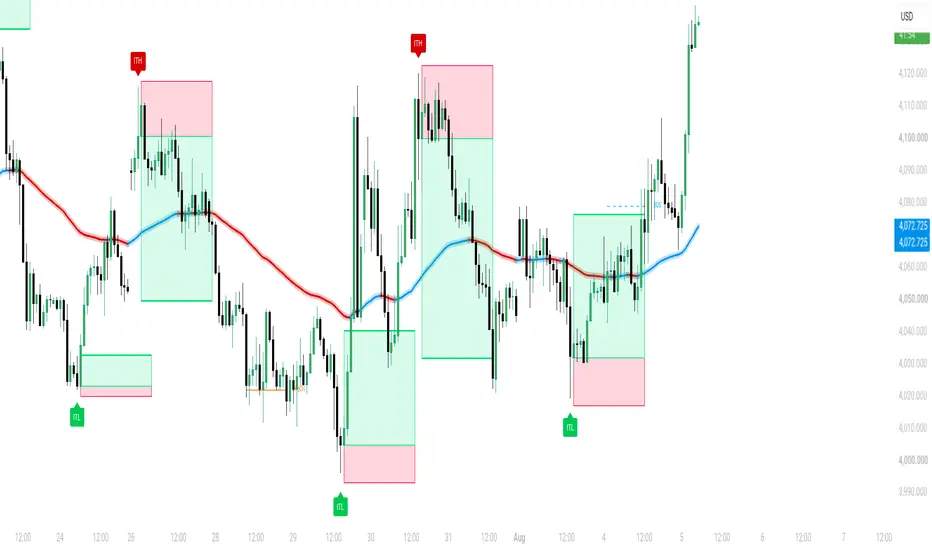
Dynamic ICT 2022 Model & Adaptive Structure PRO is an institutional grade technical analysis tool engineered specifically for traders following Smart Money Concepts and ICT 2022 mentorship models. It automatically identifies major macro structural turning points, maps order flow shifts, and plots visual execution position setups optimized for both dark and light chart themes.
Key Features Overview
1. Major Intermediate Term High and Low Badges
Automatically filters market noise to detect major macro swing extremes. Displays clean red Intermediate Term High badges above macro tops and green Intermediate Term Low badges below macro bottoms.
2. Clean Visual Position Execution Tools
Projects sleek, clutter free Long and Short position tools directly at major ITH and ITL setups. The tool automatically maps out entry levels, invalidation stop zones, and dynamic 1:3 risk to reward target areas without messy text labels.
3. Adaptive Structure Shifts
Tracks real time market structure dynamics across all timeframes. Displays precise dashed Break of Structure lines and solid Change of Character signals as price expands.
4. High Contrast Dynamic Trend Wave
Features a smooth, multi layered trend wave that clearly defines overall market direction and dynamic order flow bias, fully optimized for white and light background charts.
How to Use
Step 1: Determine Macro Bias
Follow the direction of the High Contrast Dynamic Trend Wave to identify whether institutional order flow is currently expanding bullish or bearish.
Step 2: Spot Structural Pivots
Identify major highs marked with solid red ITH badges and major lows marked with solid green ITL badges.
Step 3: Analyze Visual Setup Zones
Utilize the built in visual position tools to observe invalidation boundaries and dynamic 1:3 risk to reward target zones following Market Structure Shifts.
Settings Overview
ICT 2022 Settings
- Show Major ITH / ITL & Position Tools: Toggle visibility of pivot badges and position tool boxes.
- Major Pivot Lookback Sensitivity: Adjust pivot lookback sensitivity to isolate macro highs and lows (default set to 20).
- Target Risk to Reward: Customize reward multiplier from 1:1 up to 1:10.
Trend Wave Settings
- Show Trend Wave: Toggle visibility of the dynamic trend wave.
- Wave Period Length: Adjust wave period length to match your trading timeframe.
Market Structure Settings
- Show BOS & CHoCH Lines: Toggle structural lines and text signals.
- Structure Sensitivity: Customize structural pivot lookback length.
Disclaimer
This indicator is created strictly for educational, analytical, and charting enhancement purposes. It does not provide financial advice, trade recommendations, or guaranteed results. Always apply proper risk management principles.
Dynamic ICT 2022 Model & Adaptive Structure PRO is an institutional grade technical analysis tool engineered specifically for traders following Smart Money Concepts and ICT 2022 mentorship models. It automatically identifies major macro structural turning points, maps order flow shifts, and plots visual execution position setups optimized for both dark and light chart themes.
Key Features Overview
1. Major Intermediate Term High and Low Badges
Automatically filters market noise to detect major macro swing extremes. Displays clean red Intermediate Term High badges above macro tops and green Intermediate Term Low badges below macro bottoms.
2. Clean Visual Position Execution Tools
Projects sleek, clutter free Long and Short position tools directly at major ITH and ITL setups. The tool automatically maps out entry levels, invalidation stop zones, and dynamic 1:3 risk to reward target areas without messy text labels.
3. Adaptive Structure Shifts
Tracks real time market structure dynamics across all timeframes. Displays precise dashed Break of Structure lines and solid Change of Character signals as price expands.
4. High Contrast Dynamic Trend Wave
Features a smooth, multi layered trend wave that clearly defines overall market direction and dynamic order flow bias, fully optimized for white and light background charts.
How to Use
Step 1: Determine Macro Bias
Follow the direction of the High Contrast Dynamic Trend Wave to identify whether institutional order flow is currently expanding bullish or bearish.
Step 2: Spot Structural Pivots
Identify major highs marked with solid red ITH badges and major lows marked with solid green ITL badges.
Step 3: Analyze Visual Setup Zones
Utilize the built in visual position tools to observe invalidation boundaries and dynamic 1:3 risk to reward target zones following Market Structure Shifts.
Settings Overview
ICT 2022 Settings
- Show Major ITH / ITL & Position Tools: Toggle visibility of pivot badges and position tool boxes.
- Major Pivot Lookback Sensitivity: Adjust pivot lookback sensitivity to isolate macro highs and lows (default set to 20).
- Target Risk to Reward: Customize reward multiplier from 1:1 up to 1:10.
Trend Wave Settings
- Show Trend Wave: Toggle visibility of the dynamic trend wave.
- Wave Period Length: Adjust wave period length to match your trading timeframe.
Market Structure Settings
- Show BOS & CHoCH Lines: Toggle structural lines and text signals.
- Structure Sensitivity: Customize structural pivot lookback length.
Disclaimer
This indicator is created strictly for educational, analytical, and charting enhancement purposes. It does not provide financial advice, trade recommendations, or guaranteed results. Always apply proper risk management principles.
Informacje o Wersji
Dynamic ICT 2022 Model and Adaptive Structure PRO V2 is a comprehensive technical analysis visual utility built on Pine Script v6. It automates key Smart Money Concepts (SMC) and Inner Circle Trader (ICT) framework visuals directly on TradingView charts.The script combines market structure mapping, major structural liquidity points, dynamic trend direction, Fair Value Gaps (FVGs), and visual Risk-to-Reward reference tools. The visual theme is optimized specifically for light and white chart backgrounds to ensure clear readability without clutter.
KEY FEATURES AND LOGIC
1. Major Intermediate-Term Highs and Lows (ITH / ITL):
Identifies major market pivots using swing highs and lows with configurable lookback sensitivity. Solid badge labels are plotted above and below structural points using ATR buffering.
2. Automated Position Reference Tool:
When a major ITH or ITL forms, the script displays visual Stop Loss zones based on the swing extreme and projects Take Profit zones using a customizable Risk-to-Reward ratio (default 1:3).
3. Dynamic High-Contrast Trend Wave:
Employs an EMA core with a halo effect to visually emphasize overall trend direction (Cyan for bullish, Red for bearish).
4. Market Structure Mapping (BOS and CHoCH):
Tracks recent structural swing points. Break of Structure (BOS) is rendered with dashed lines, while Change of Character (CHoCH) is rendered with solid lines.
5. Fair Value Gap (FVG) Detection:
Scans 3-candle sequences for price inefficiencies and highlights active imbalance zones.
SETTINGS AND INPUTS GUIDE
- Pivot Lookback Sensitivity: Controls left and right bar checks for confirming major swings. Lower values suit fast scalping; higher values isolate macro swings.
- Target Risk-to-Reward: Adjusts the expansion multiplier for projected target zones relative to defined Stop Loss risk.
- Wave Period Length: Sets the period length for the EMA trend filter.
- Structure Sensitivity: Sets the lookback window for detecting BOS and CHoCH lines.
- FVG Settings: Toggle imbalance zones and adjust visual transparency.
HOW TO USE
1. Determine Overall Bias: Observe the color of the High-Contrast Glowing Wave to gauge broad market momentum.
2. Identify Structural Shifts: Wait for price to clear liquidity near a Major ITH or ITL and look for a CHoCH confirmation.
3. Locate Confluence: Search for active Fair Value Gap zones created during displacement moves for retest entry visual tracking.
4. Risk Management: Use the projected position tools as a static reference to visually verify risk parameters against logical chart levels.
DISCLAIMER
This script is purely an educational tool designed for visual market study and chart analysis. It does not generate automated execution signals or provide financial trading advice. Always manage your risk responsibly.
Skrypt open-source
W zgodzie z duchem TradingView twórca tego skryptu udostępnił go jako open-source, aby użytkownicy mogli przejrzeć i zweryfikować jego działanie. Ukłony dla autora. Korzystanie jest bezpłatne, jednak ponowna publikacja kodu podlega naszym Zasadom serwisu.

Follow The Trend Not The Crowd
Free Telegram Channel
t.me/+M7U84ec7_HYxMjU0
Free Telegram Channel
t.me/+M7U84ec7_HYxMjU0
Wyłączenie odpowiedzialności
Informacje i publikacje nie stanowią i nie powinny być traktowane jako porady finansowe, inwestycyjne, tradingowe ani jakiekolwiek inne rekomendacje dostarczane lub zatwierdzone przez TradingView. Więcej informacji znajduje się w Warunkach użytkowania.
Skrypt open-source
W zgodzie z duchem TradingView twórca tego skryptu udostępnił go jako open-source, aby użytkownicy mogli przejrzeć i zweryfikować jego działanie. Ukłony dla autora. Korzystanie jest bezpłatne, jednak ponowna publikacja kodu podlega naszym Zasadom serwisu.
Follow The Trend Not The Crowd
Free Telegram Channel
t.me/+M7U84ec7_HYxMjU0
Free Telegram Channel
t.me/+M7U84ec7_HYxMjU0
Wyłączenie odpowiedzialności
Informacje i publikacje nie stanowią i nie powinny być traktowane jako porady finansowe, inwestycyjne, tradingowe ani jakiekolwiek inne rekomendacje dostarczane lub zatwierdzone przez TradingView. Więcej informacji znajduje się w Warunkach użytkowania.