PowerHouse SwiftEdge v3
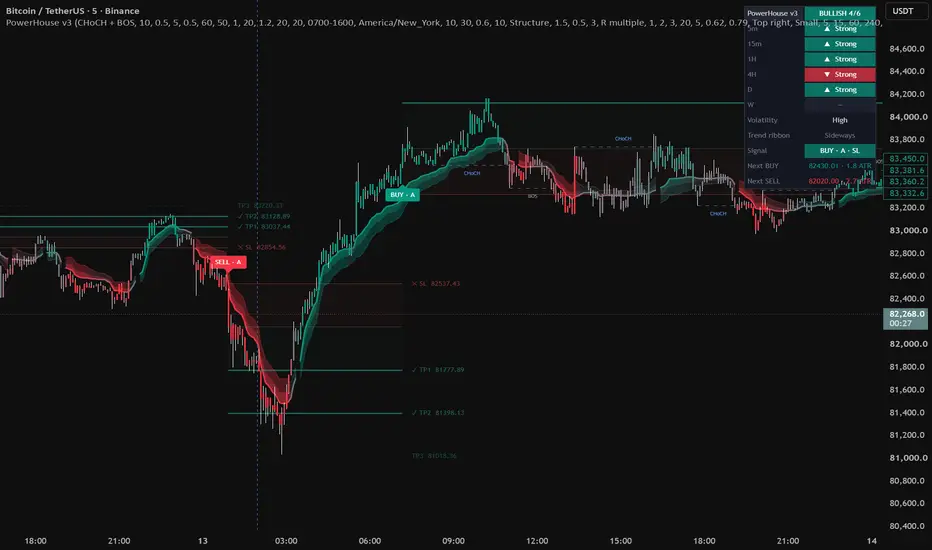
PowerHouse SwiftEdge v3 is the third generation of PowerHouse. It keeps what made v2 popular (structure signals, Get Ready pre-signals, filters you choose yourself, take-profit levels and a multi-timeframe dashboard) and rebuilds every part of it. Each signal now comes with a quality grade and a complete trade plan, the trend ribbon fades to neutral when the market goes sideways, and a colour-coded Trend Matrix shows the bias across six timeframes at a glance.
SIGNALS
• Market structure: swing highs and lows are confirmed with a structure length on each side. A close beyond the last unbroken swing high is a bullish break, a close beyond the last unbroken swing low a bearish break.
– CHoCH (change of character): the first break against the current structure, a possible reversal.
– BOS (break of structure): a break in the direction of the structure, a continuation.
Choose CHoCH + BOS, CHoCH only or BOS only. Structure lines with a CHoCH or BOS tag show where each break happened, and swing labels (HH, HL, LH, LL) show how the structure is building.
• Trigger levels: dotted lines at the unbroken swing high and low mark exactly where the next BUY and the next SELL would trigger.
• BUY and SELL labels print on the bar that closes beyond the level, when every enabled filter agrees. By default, only one signal per direction is shown until the opposite signal.
• Get Ready: a small pre-signal when price closes within a set ATR distance of the level that would trigger a signal and the enabled filters (except momentum and breakout) already agree.
FILTERS
Each filter can be switched on or off. Every enabled filter must agree with the signal:
– Momentum: the move over N bars, measured in ATR.
– Higher-timeframe trend: close vs EMA on a higher timeframe, from closed bars only.
– Lower-timeframe trend: close vs EMA on a lower timeframe.
– Volume: volume above a multiple of its 20-bar average.
– Breakout: the signal bar also closes beyond the highest high (lowest low) of a lookback.
– Order flow (CVD): cumulative volume delta over N bars points the same way. Delta is estimated from lower-timeframe candles.
– Trend ribbon: the ribbon's trend score does not clearly point the other way. A neutral ribbon allows signals in both directions, so reversals (CHoCH) are not filtered out.
– Session window (optional): signals only inside a chosen session.
GRADE A / B / C
Every signal is graded by how many of the seven checks agree with it, whether they are enabled or not: A for five or more, B for three or four, C for fewer. Hover a signal to see the full checklist.
TRADE PLAN
Each signal draws a plan:
– Entry at the signal close.
– Stop beyond the opposite swing (kept between a minimum and a maximum ATR distance) or a fixed ATR multiple.
– TP1, TP2 and TP3 in R multiples, ATR multiples or points, each with its own switch.
The plan is drawn like a position tool: a risk zone, a reward band for each target and price tags on every level. The next target still to reach is highlighted, targets are ticked (✓) when reached and the stop is marked (✕). Optionally, each target label can show its historical hit rate on the chart.
TREND RIBBON
An adaptive, layered ribbon based on Kaufman's adaptive moving average. It speeds up in clean trends and slows down in choppy markets.
– Its colour follows a smoothed trend score built from the baseline slope and the distance of price from the baseline. In consolidation the colour fades through neutral grey instead of jumping between red and green, and it turns green or red gradually as a trend builds.
– The direction only changes when price closes beyond the baseline by a flip band (0.6 ATR by default) and the trend score agrees, which keeps the ribbon steady in ranges.
– Width and brightness grow with conviction, and the candles are shaded with the same colour.
ICT LAYER
– OTE zone: the optimal trade entry zone (0.62 to 0.79 retracement by default) of the current structure leg.
– Equilibrium: the 50% level of the same leg, with the premium half and the discount half shaded.
DASHBOARD
– Bias header: how many timeframes point the same way (for example BULLISH 5/6).
– Trend Matrix: trend on six timeframes (5m, 15m, 1H, 4H, D and W by default) from closed bars, as colour-coded cells for strong or weak up or down.
– Volatility: low, normal or high from the ATR percentile.
– Trend ribbon: direction and conviction, or "Sideways" when there is no clear trend.
– Signal: the latest signal, its grade and its progress.
– Next BUY / Next SELL: the trigger levels and their distance in ATR.
HOW TO USE IT
• Start with the default filters (momentum, higher-timeframe trend and the ribbon), then switch filters on or off to match your style: fewer filters for more signals, more filters for stricter ones.
• Use the grade and the Trend Matrix to separate stronger signals from weaker ones. A grade A signal in the direction of a strong bias is the most aligned setup the script can show.
• A grey ribbon means the market has no clear trend. Treat signals there with extra caution and use the OTE zone, the equilibrium and the trigger levels for context.
• Use Get Ready labels to prepare, not to enter. Signals are only final on the bar close.
• Watch the trigger levels and the Next BUY / Next SELL distance to see how close the next structure break is.
NOTES AND LIMITATIONS
• Swings are confirmed a structure length after the high or low, so structure levels appear with that delay. Signals, Get Ready labels and target hits are decided on bar close and do not change afterwards. Higher-timeframe data uses closed bars only.
• Targets and stops are checked against each bar's high and low from the bar after the signal. When the stop and a target are both touched in the same bar, the stop counts first.
• Order-flow delta is an estimate from lower-timeframe candles, not true bid/ask data.
• Hit rates (optional on the target labels) describe the history loaded on your chart and depend on the settings, the symbol, the timeframe and the data feed. They are a measurement, not a forecast.
This script is for analysis and education. It does not provide trading advice, and past behaviour shown on the chart does not imply future results.
SIGNALS
• Market structure: swing highs and lows are confirmed with a structure length on each side. A close beyond the last unbroken swing high is a bullish break, a close beyond the last unbroken swing low a bearish break.
– CHoCH (change of character): the first break against the current structure, a possible reversal.
– BOS (break of structure): a break in the direction of the structure, a continuation.
Choose CHoCH + BOS, CHoCH only or BOS only. Structure lines with a CHoCH or BOS tag show where each break happened, and swing labels (HH, HL, LH, LL) show how the structure is building.
• Trigger levels: dotted lines at the unbroken swing high and low mark exactly where the next BUY and the next SELL would trigger.
• BUY and SELL labels print on the bar that closes beyond the level, when every enabled filter agrees. By default, only one signal per direction is shown until the opposite signal.
• Get Ready: a small pre-signal when price closes within a set ATR distance of the level that would trigger a signal and the enabled filters (except momentum and breakout) already agree.
FILTERS
Each filter can be switched on or off. Every enabled filter must agree with the signal:
– Momentum: the move over N bars, measured in ATR.
– Higher-timeframe trend: close vs EMA on a higher timeframe, from closed bars only.
– Lower-timeframe trend: close vs EMA on a lower timeframe.
– Volume: volume above a multiple of its 20-bar average.
– Breakout: the signal bar also closes beyond the highest high (lowest low) of a lookback.
– Order flow (CVD): cumulative volume delta over N bars points the same way. Delta is estimated from lower-timeframe candles.
– Trend ribbon: the ribbon's trend score does not clearly point the other way. A neutral ribbon allows signals in both directions, so reversals (CHoCH) are not filtered out.
– Session window (optional): signals only inside a chosen session.
GRADE A / B / C
Every signal is graded by how many of the seven checks agree with it, whether they are enabled or not: A for five or more, B for three or four, C for fewer. Hover a signal to see the full checklist.
TRADE PLAN
Each signal draws a plan:
– Entry at the signal close.
– Stop beyond the opposite swing (kept between a minimum and a maximum ATR distance) or a fixed ATR multiple.
– TP1, TP2 and TP3 in R multiples, ATR multiples or points, each with its own switch.
The plan is drawn like a position tool: a risk zone, a reward band for each target and price tags on every level. The next target still to reach is highlighted, targets are ticked (✓) when reached and the stop is marked (✕). Optionally, each target label can show its historical hit rate on the chart.
TREND RIBBON
An adaptive, layered ribbon based on Kaufman's adaptive moving average. It speeds up in clean trends and slows down in choppy markets.
– Its colour follows a smoothed trend score built from the baseline slope and the distance of price from the baseline. In consolidation the colour fades through neutral grey instead of jumping between red and green, and it turns green or red gradually as a trend builds.
– The direction only changes when price closes beyond the baseline by a flip band (0.6 ATR by default) and the trend score agrees, which keeps the ribbon steady in ranges.
– Width and brightness grow with conviction, and the candles are shaded with the same colour.
ICT LAYER
– OTE zone: the optimal trade entry zone (0.62 to 0.79 retracement by default) of the current structure leg.
– Equilibrium: the 50% level of the same leg, with the premium half and the discount half shaded.
DASHBOARD
– Bias header: how many timeframes point the same way (for example BULLISH 5/6).
– Trend Matrix: trend on six timeframes (5m, 15m, 1H, 4H, D and W by default) from closed bars, as colour-coded cells for strong or weak up or down.
– Volatility: low, normal or high from the ATR percentile.
– Trend ribbon: direction and conviction, or "Sideways" when there is no clear trend.
– Signal: the latest signal, its grade and its progress.
– Next BUY / Next SELL: the trigger levels and their distance in ATR.
HOW TO USE IT
• Start with the default filters (momentum, higher-timeframe trend and the ribbon), then switch filters on or off to match your style: fewer filters for more signals, more filters for stricter ones.
• Use the grade and the Trend Matrix to separate stronger signals from weaker ones. A grade A signal in the direction of a strong bias is the most aligned setup the script can show.
• A grey ribbon means the market has no clear trend. Treat signals there with extra caution and use the OTE zone, the equilibrium and the trigger levels for context.
• Use Get Ready labels to prepare, not to enter. Signals are only final on the bar close.
• Watch the trigger levels and the Next BUY / Next SELL distance to see how close the next structure break is.
NOTES AND LIMITATIONS
• Swings are confirmed a structure length after the high or low, so structure levels appear with that delay. Signals, Get Ready labels and target hits are decided on bar close and do not change afterwards. Higher-timeframe data uses closed bars only.
• Targets and stops are checked against each bar's high and low from the bar after the signal. When the stop and a target are both touched in the same bar, the stop counts first.
• Order-flow delta is an estimate from lower-timeframe candles, not true bid/ask data.
• Hit rates (optional on the target labels) describe the history loaded on your chart and depend on the settings, the symbol, the timeframe and the data feed. They are a measurement, not a forecast.
This script is for analysis and education. It does not provide trading advice, and past behaviour shown on the chart does not imply future results.

Free live order book heatmap, footprint and CVD for BTC, gold and 7 more markets: swiftedge.uk/bitcoin-order-book-heatmap
Wyłączenie odpowiedzialności
Informacje i publikacje nie stanowią i nie powinny być traktowane jako porady finansowe, inwestycyjne, tradingowe ani jakiekolwiek inne rekomendacje dostarczane lub zatwierdzone przez TradingView. Więcej informacji znajduje się w Warunkach użytkowania.
Free live order book heatmap, footprint and CVD for BTC, gold and 7 more markets: swiftedge.uk/bitcoin-order-book-heatmap
Wyłączenie odpowiedzialności
Informacje i publikacje nie stanowią i nie powinny być traktowane jako porady finansowe, inwestycyjne, tradingowe ani jakiekolwiek inne rekomendacje dostarczane lub zatwierdzone przez TradingView. Więcej informacji znajduje się w Warunkach użytkowania.