OPEN-SOURCE SCRIPT
EMA + VWAP + Bollinger Bands Combo
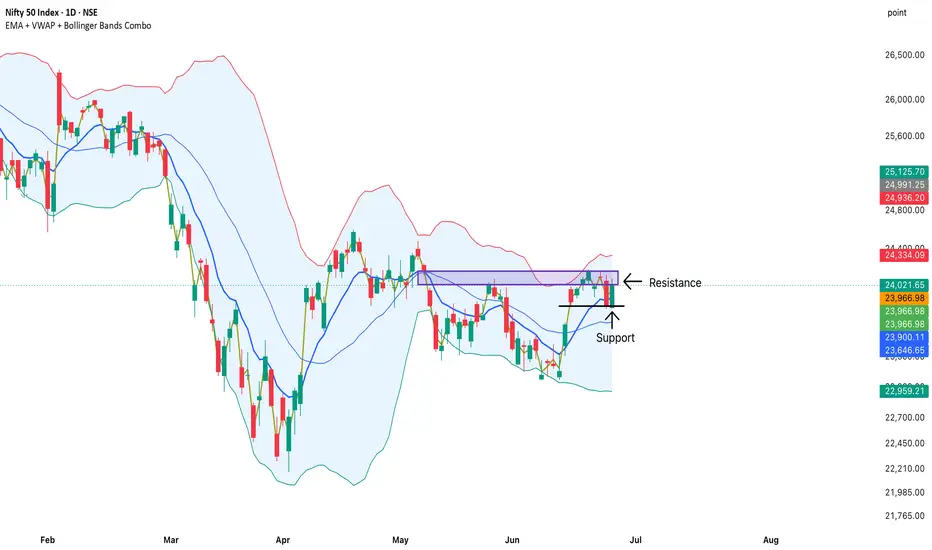
# EMA + VWAP + Bollinger Bands Combo
This indicator combines three of the most popular technical analysis tools into a single customizable overlay: Exponential Moving Average (EMA), Volume Weighted Average Price (VWAP), and Bollinger Bands.
Instead of adding multiple indicators to your chart, you can manage all three from a single script and enable only the tools you need.
### Features
✅ **Exponential Moving Average (EMA)**
* Customizable length and source
* Optional display toggle
* Useful for identifying trend direction and dynamic support/resistance
✅ **Volume Weighted Average Price (VWAP)**
* Supports Session, Weekly, Monthly, Quarterly, and Yearly anchors
* Optional VWAP deviation bands
* Useful for institutional price analysis and intraday trend confirmation
✅ **Bollinger Bands**
* Customizable length and standard deviation settings
* Supports SMA, EMA, RMA (SMMA), WMA, and VWMA as the basis
* Useful for volatility analysis, breakout detection, and mean-reversion setups
### Display Combinations
The indicator allows any combination of:
* EMA only
* VWAP only
* Bollinger Bands only
* EMA + VWAP
* EMA + Bollinger Bands
* VWAP + Bollinger Bands
* EMA + VWAP + Bollinger Bands
### How Traders Commonly Use It
**Trend Following**
* Price above EMA and VWAP can indicate bullish conditions.
* Price below EMA and VWAP can indicate bearish conditions.
**Intraday Trading**
* VWAP acts as a key institutional reference level.
* VWAP bands can help identify stretched price conditions.
**Volatility Analysis**
* Bollinger Band expansion may indicate increasing volatility.
* Bollinger Band contraction may indicate potential breakout conditions.
**Confluence Zones**
* Areas where EMA, VWAP, and Bollinger Bands align can provide stronger support and resistance levels.
### Notes
This indicator is designed as a convenience tool that combines multiple commonly used overlays into a single script, helping reduce chart clutter while maintaining flexibility and customization.
This indicator combines three of the most popular technical analysis tools into a single customizable overlay: Exponential Moving Average (EMA), Volume Weighted Average Price (VWAP), and Bollinger Bands.
Instead of adding multiple indicators to your chart, you can manage all three from a single script and enable only the tools you need.
### Features
✅ **Exponential Moving Average (EMA)**
* Customizable length and source
* Optional display toggle
* Useful for identifying trend direction and dynamic support/resistance
✅ **Volume Weighted Average Price (VWAP)**
* Supports Session, Weekly, Monthly, Quarterly, and Yearly anchors
* Optional VWAP deviation bands
* Useful for institutional price analysis and intraday trend confirmation
✅ **Bollinger Bands**
* Customizable length and standard deviation settings
* Supports SMA, EMA, RMA (SMMA), WMA, and VWMA as the basis
* Useful for volatility analysis, breakout detection, and mean-reversion setups
### Display Combinations
The indicator allows any combination of:
* EMA only
* VWAP only
* Bollinger Bands only
* EMA + VWAP
* EMA + Bollinger Bands
* VWAP + Bollinger Bands
* EMA + VWAP + Bollinger Bands
### How Traders Commonly Use It
**Trend Following**
* Price above EMA and VWAP can indicate bullish conditions.
* Price below EMA and VWAP can indicate bearish conditions.
**Intraday Trading**
* VWAP acts as a key institutional reference level.
* VWAP bands can help identify stretched price conditions.
**Volatility Analysis**
* Bollinger Band expansion may indicate increasing volatility.
* Bollinger Band contraction may indicate potential breakout conditions.
**Confluence Zones**
* Areas where EMA, VWAP, and Bollinger Bands align can provide stronger support and resistance levels.
### Notes
This indicator is designed as a convenience tool that combines multiple commonly used overlays into a single script, helping reduce chart clutter while maintaining flexibility and customization.
Skrypt open-source
W zgodzie z duchem TradingView twórca tego skryptu udostępnił go jako open-source, aby użytkownicy mogli przejrzeć i zweryfikować jego działanie. Ukłony dla autora. Korzystanie jest bezpłatne, jednak ponowna publikacja kodu podlega naszym Zasadom serwisu.

Wyłączenie odpowiedzialności
Informacje i publikacje nie stanowią i nie powinny być traktowane jako porady finansowe, inwestycyjne, tradingowe ani jakiekolwiek inne rekomendacje dostarczane lub zatwierdzone przez TradingView. Więcej informacji znajduje się w Warunkach użytkowania.
Skrypt open-source
W zgodzie z duchem TradingView twórca tego skryptu udostępnił go jako open-source, aby użytkownicy mogli przejrzeć i zweryfikować jego działanie. Ukłony dla autora. Korzystanie jest bezpłatne, jednak ponowna publikacja kodu podlega naszym Zasadom serwisu.
Wyłączenie odpowiedzialności
Informacje i publikacje nie stanowią i nie powinny być traktowane jako porady finansowe, inwestycyjne, tradingowe ani jakiekolwiek inne rekomendacje dostarczane lub zatwierdzone przez TradingView. Więcej informacji znajduje się w Warunkach użytkowania.