OPEN-SOURCE SCRIPT
Institutional Dealer Exposure
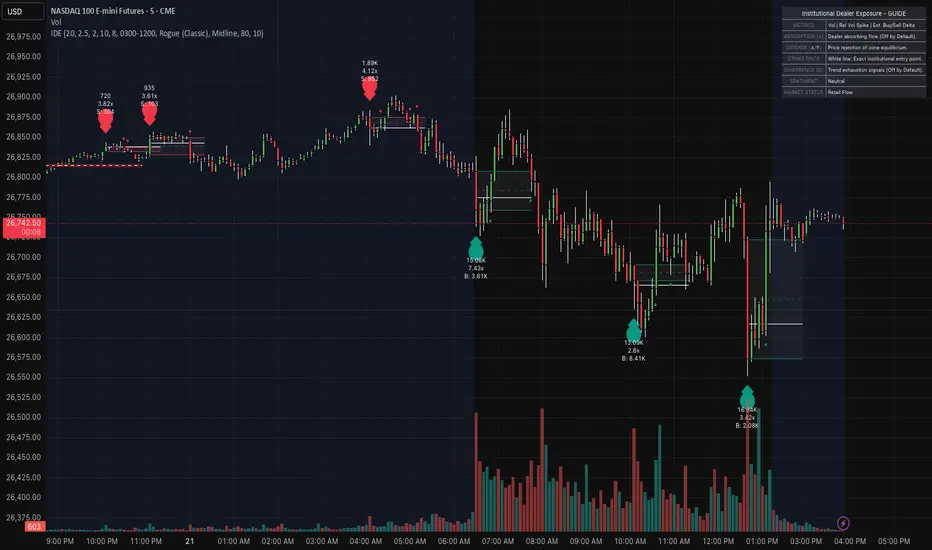
Institutional Dealer Exposure: The Market Maker Footprint
In the high-frequency world of Futures (NQ, ES, GC), liquidity is not just a number—it is a battleground. Market Makers (Dealers) are required to provide liquidity by taking the opposite side of every retail and institutional order. When a massive "Order Flow" imbalance occurs, dealers are often forced into "unbalanced inventory" positions.
The Institutional Dealer Exposure indicator is a sophisticated volatility-volume model designed to track these forced dealer entries. By calculating the statistical deviation of price from its Volume Weighted Average Price (VWAP) in conjunction with Relative Volume spikes, this tool identifies the exact "Strike Prices" where dealers are stepping in to facilitate reversals and balance their books.
The Mathematical Engine (The "Dealer Inventory" Proxy)
The core of this indicator relies on the relationship between Volume, Price, and Fair Value. Unlike standard oscillators, this tool uses a "Z-Score" model of price-VWAP deviation:
Volume Weighted Average Price (VWAP): We utilize VWAP as the "Anchor of Fair Value." Dealers generally try to keep the market near this mean.
Exposure Z-Score: We calculate the Standard Deviation of the distance between the current Price and VWAP. When the Z-Score exceeds +/- 2.0 (user-adjustable), it indicates a statistical anomaly—meaning the market is "over-extended" in a way that requires institutional intervention.
Relative Volume (RVold): A signal is only valid if it occurs during an Institutional Volatility Spike. We compare the current bar's volume to a 20-period average. If the volume is 2.5x the average (default), it confirms that "Big Money" is active.
Estimated Delta: The tool analyzes the internal candle action to estimate Buy vs. Sell pressure, providing a "B:" or "S:" metric on every bubble to show the aggressive intent of participants.
Visual Execution & Advanced Order Flow Features
The script is built for professional clarity, providing a "layered" view of the market's internal mechanics:
Exposure Bubbles: High-visibility markers that trigger only on Volume Climaxes (local peaks). These represent the "Entry Points" of institutional hedging.
Dealer Zones: These are projected areas of interest. Unlike standard supply/demand zones, these are calculated from the high/low of the specific institutional "Climax Candle."
The Strike Price (POC): Every zone contains a solid white line representing the exact average price of the institutional entry. This acts as a high-precision magnet for future retests.
Internal Levels (Midline/Fib/Defense): Users can toggle between the Midline (Equilibrium), Fibonacci levels, or the "80% Defense Line." These show exactly where the dealer is likely to protect their position.
Auto-Invalidation: In a fast market like NQ, broken levels are dangerous. If the market closes beyond the 80% Defense Line, the zone automatically turns Gray, signaling that the institutional interest has shifted.
Professional Strategy & Market Application
This tool is optimized for the 1-Minute and 5-Minute timeframes on high-liquidity assets like Nasdaq (NQ), S&P 500 (ES), and Gold (GC).
The "Dealer Rejection" Setup:
Wait for the Bubble: Identify an extreme inventory imbalance.
Watch the Midline: After the bubble, look for the Institutional Defense Signals (▲/▼). These triangles appear when price retests the zone's midline and rejects it, confirming the dealer is "defending" the level.
The Absorption Factor (Optional): Enable the "A" markers to find "Hidden Orders." This highlights bars where massive volume was absorbed by the dealer without allowing price to continue in the direction of the trend—a classic institutional trap.
The Divergence Warning (Optional): Enable "D" markers to catch trend exhaustion. If price makes a new high but the Dealer Inventory Z-score is dropping, a reversal is imminent.
Trading the Power Hours:
Use the built-in Session Filter to focus strictly on the London and New York opens, where dealer inventory fluctuates the most. Combine this with the Higher Timeframe Trend Filter (EMA 200) to ensure you are trading alongside the broader institutional flow.
In the high-frequency world of Futures (NQ, ES, GC), liquidity is not just a number—it is a battleground. Market Makers (Dealers) are required to provide liquidity by taking the opposite side of every retail and institutional order. When a massive "Order Flow" imbalance occurs, dealers are often forced into "unbalanced inventory" positions.
The Institutional Dealer Exposure indicator is a sophisticated volatility-volume model designed to track these forced dealer entries. By calculating the statistical deviation of price from its Volume Weighted Average Price (VWAP) in conjunction with Relative Volume spikes, this tool identifies the exact "Strike Prices" where dealers are stepping in to facilitate reversals and balance their books.
The Mathematical Engine (The "Dealer Inventory" Proxy)
The core of this indicator relies on the relationship between Volume, Price, and Fair Value. Unlike standard oscillators, this tool uses a "Z-Score" model of price-VWAP deviation:
Volume Weighted Average Price (VWAP): We utilize VWAP as the "Anchor of Fair Value." Dealers generally try to keep the market near this mean.
Exposure Z-Score: We calculate the Standard Deviation of the distance between the current Price and VWAP. When the Z-Score exceeds +/- 2.0 (user-adjustable), it indicates a statistical anomaly—meaning the market is "over-extended" in a way that requires institutional intervention.
Relative Volume (RVold): A signal is only valid if it occurs during an Institutional Volatility Spike. We compare the current bar's volume to a 20-period average. If the volume is 2.5x the average (default), it confirms that "Big Money" is active.
Estimated Delta: The tool analyzes the internal candle action to estimate Buy vs. Sell pressure, providing a "B:" or "S:" metric on every bubble to show the aggressive intent of participants.
Visual Execution & Advanced Order Flow Features
The script is built for professional clarity, providing a "layered" view of the market's internal mechanics:
Exposure Bubbles: High-visibility markers that trigger only on Volume Climaxes (local peaks). These represent the "Entry Points" of institutional hedging.
Dealer Zones: These are projected areas of interest. Unlike standard supply/demand zones, these are calculated from the high/low of the specific institutional "Climax Candle."
The Strike Price (POC): Every zone contains a solid white line representing the exact average price of the institutional entry. This acts as a high-precision magnet for future retests.
Internal Levels (Midline/Fib/Defense): Users can toggle between the Midline (Equilibrium), Fibonacci levels, or the "80% Defense Line." These show exactly where the dealer is likely to protect their position.
Auto-Invalidation: In a fast market like NQ, broken levels are dangerous. If the market closes beyond the 80% Defense Line, the zone automatically turns Gray, signaling that the institutional interest has shifted.
Professional Strategy & Market Application
This tool is optimized for the 1-Minute and 5-Minute timeframes on high-liquidity assets like Nasdaq (NQ), S&P 500 (ES), and Gold (GC).
The "Dealer Rejection" Setup:
Wait for the Bubble: Identify an extreme inventory imbalance.
Watch the Midline: After the bubble, look for the Institutional Defense Signals (▲/▼). These triangles appear when price retests the zone's midline and rejects it, confirming the dealer is "defending" the level.
The Absorption Factor (Optional): Enable the "A" markers to find "Hidden Orders." This highlights bars where massive volume was absorbed by the dealer without allowing price to continue in the direction of the trend—a classic institutional trap.
The Divergence Warning (Optional): Enable "D" markers to catch trend exhaustion. If price makes a new high but the Dealer Inventory Z-score is dropping, a reversal is imminent.
Trading the Power Hours:
Use the built-in Session Filter to focus strictly on the London and New York opens, where dealer inventory fluctuates the most. Combine this with the Higher Timeframe Trend Filter (EMA 200) to ensure you are trading alongside the broader institutional flow.
Skrypt open-source
W zgodzie z duchem TradingView twórca tego skryptu udostępnił go jako open-source, aby użytkownicy mogli przejrzeć i zweryfikować jego działanie. Ukłony dla autora. Korzystanie jest bezpłatne, jednak ponowna publikacja kodu podlega naszym Zasadom serwisu.

Wyłączenie odpowiedzialności
Informacje i publikacje nie stanowią i nie powinny być traktowane jako porady finansowe, inwestycyjne, tradingowe ani jakiekolwiek inne rekomendacje dostarczane lub zatwierdzone przez TradingView. Więcej informacji znajduje się w Warunkach użytkowania.
Skrypt open-source
W zgodzie z duchem TradingView twórca tego skryptu udostępnił go jako open-source, aby użytkownicy mogli przejrzeć i zweryfikować jego działanie. Ukłony dla autora. Korzystanie jest bezpłatne, jednak ponowna publikacja kodu podlega naszym Zasadom serwisu.
Wyłączenie odpowiedzialności
Informacje i publikacje nie stanowią i nie powinny być traktowane jako porady finansowe, inwestycyjne, tradingowe ani jakiekolwiek inne rekomendacje dostarczane lub zatwierdzone przez TradingView. Więcej informacji znajduje się w Warunkach użytkowania.