Zaktualizowano
YES RSI + BB Sniper
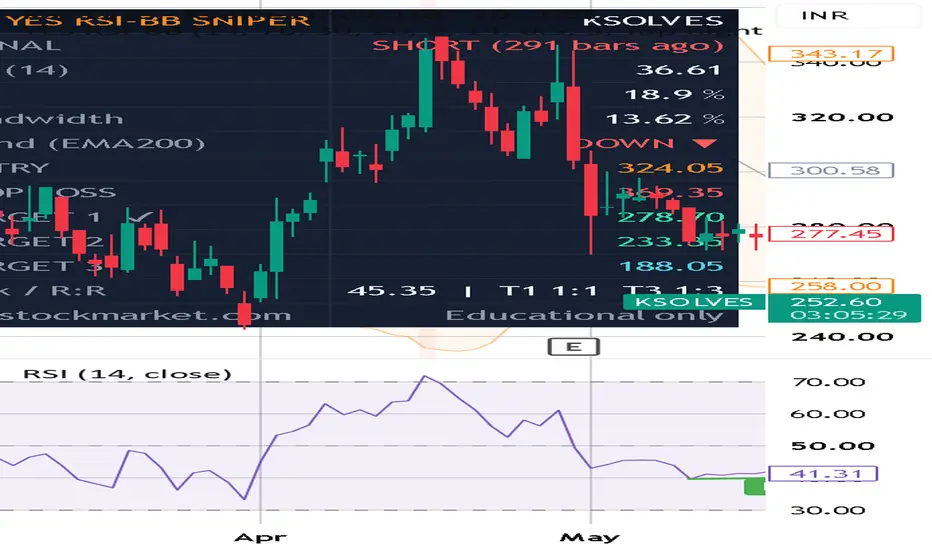
YES RSI + BB Sniper — Mean-Reversion Setup Tool with Auto Entry/SL/Targets
What it does:
This indicator combines RSI and Bollinger Bands to identify mean-reversion setups, then automatically plots a complete trade plan — Entry, Stop Loss, and three Targets — with a live dashboard tracking every level.
Signal Logic:
LONG: Price tags the lower Bollinger Band AND RSI crosses back above the oversold level (default 30) — exhaustion + momentum shift confirmation
SHORT: Price tags the upper band AND RSI crosses back below overbought (default 70)
Optional EMA-200 trend filter to trade only with the larger trend
Auto Trade Levels:
Entry: Signal candle close
Stop Loss: Beyond the band/swing extreme with an ATR-based buffer (adjustable)
Target 1: BB Basis (the mean — natural magnet in mean-reversion), minimum 1R
Target 2: Opposite band, minimum 2R
Target 3: Configurable Risk:Reward runner (default 1:3)
Dashboard shows: Signal status with bar count, RSI value, %B, Bandwidth (squeeze detection below 4%), trend direction, all trade levels with real-time hit-tracking (✔/✖), and Risk:Reward ratios.
Alerts: Built-in alert conditions for both LONG and SHORT setups.
How to use: Works best on Daily and 1H timeframes for swing trades. Wait for the signal candle to close, verify the R:R on the dashboard suits your plan, and always size positions according to your risk management.
This is an educational tool, not financial advice. Always do your own analysis before trading.
What it does:
This indicator combines RSI and Bollinger Bands to identify mean-reversion setups, then automatically plots a complete trade plan — Entry, Stop Loss, and three Targets — with a live dashboard tracking every level.
Signal Logic:
LONG: Price tags the lower Bollinger Band AND RSI crosses back above the oversold level (default 30) — exhaustion + momentum shift confirmation
SHORT: Price tags the upper band AND RSI crosses back below overbought (default 70)
Optional EMA-200 trend filter to trade only with the larger trend
Auto Trade Levels:
Entry: Signal candle close
Stop Loss: Beyond the band/swing extreme with an ATR-based buffer (adjustable)
Target 1: BB Basis (the mean — natural magnet in mean-reversion), minimum 1R
Target 2: Opposite band, minimum 2R
Target 3: Configurable Risk:Reward runner (default 1:3)
Dashboard shows: Signal status with bar count, RSI value, %B, Bandwidth (squeeze detection below 4%), trend direction, all trade levels with real-time hit-tracking (✔/✖), and Risk:Reward ratios.
Alerts: Built-in alert conditions for both LONG and SHORT setups.
How to use: Works best on Daily and 1H timeframes for swing trades. Wait for the signal candle to close, verify the R:R on the dashboard suits your plan, and always size positions according to your risk management.
This is an educational tool, not financial advice. Always do your own analysis before trading.
Informacje o Wersji
YES RSI + BB Sniper [YES STOCK MARKET]A mean-reversion indicator that combines RSI and Bollinger Bands. It shows entry, stop-loss and three target levels on the chart, marks where each trade ended, and tracks the current trade in a dashboard.
How signals work
BUY: price touches the lower Bollinger Band, then RSI crosses back up above the oversold level (default 30).
SELL: price touches the upper Bollinger Band, then RSI crosses back down below the overbought level (default 70).
Optional EMA-200 trend filter: longs only above the EMA-200, shorts only below.
Only one trade at a time. No new signal appears until the current trade hits its SL or its final target.
Trade levels (plotted automatically)
Entry: close of the signal candle.
Stop loss: the signal candle's low/high or the band, whichever is further, plus an ATR buffer.
Target 1: the BB basis (middle band), at least 1R.
Target 2: the opposite Bollinger Band, at least 2R.
Target 3: a runner target based on risk:reward (default 3R), always placed beyond T2.
Hit tracking
A "SL HIT" marker appears on the candle where the stop loss is hit, and the target lines are removed.
"✔ T1 / T2 / T3 HIT" markers appear on the candle where each target is hit, and the SL line is removed.
If the SL and a target are both touched on the same candle, it counts as an SL hit.
Dashboard
Shows the current signal and how many bars ago it fired, RSI, %B, bandwidth (low values point to a squeeze), trend compared with the EMA-200, and the Entry, SL, T1, T2, T3 levels with hit status, risk and R:R.
Settings
RSI length and levels, BB length and multiplier, ATR length and SL buffer, T3 risk:reward, trend filter, one-trade mode, hit markers, and dashboard position and size.
Alerts
Alerts for a new LONG setup and a new SHORT setup.
Best use
Mean-reversion works best in sideways or range-bound markets. In a strong trend, turn on the EMA-200 filter to avoid trading against the trend. Confirm signals with price action and support/resistance.

Wyłączenie odpowiedzialności
Informacje i publikacje nie stanowią i nie powinny być traktowane jako porady finansowe, inwestycyjne, tradingowe ani jakiekolwiek inne rekomendacje dostarczane lub zatwierdzone przez TradingView. Więcej informacji znajduje się w Warunkach użytkowania.
Wyłączenie odpowiedzialności
Informacje i publikacje nie stanowią i nie powinny być traktowane jako porady finansowe, inwestycyjne, tradingowe ani jakiekolwiek inne rekomendacje dostarczane lub zatwierdzone przez TradingView. Więcej informacji znajduje się w Warunkach użytkowania.