Trading Module [BackQuant]
Trading Module [BackQuant]
Overview
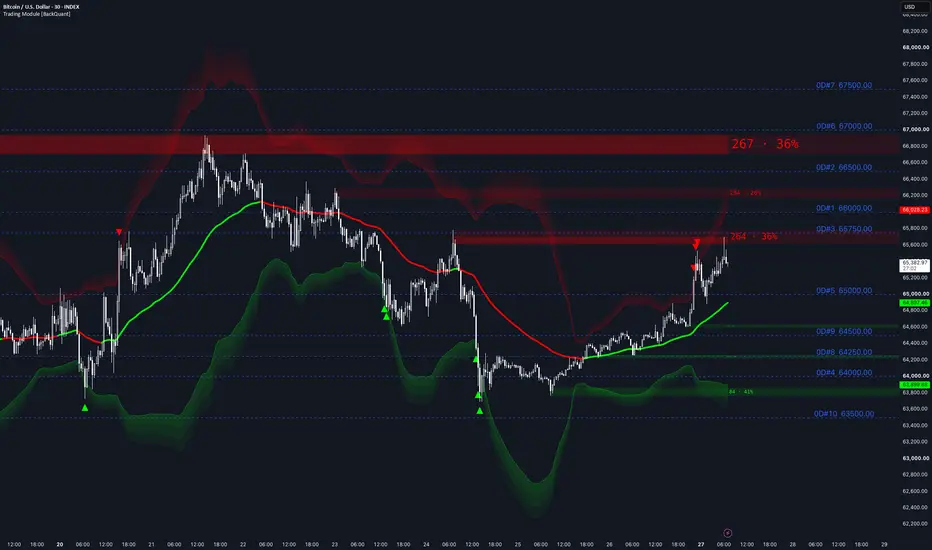
Trading Module is a modular visual decision-support overlay designed to bring directional analysis, momentum timing, market structure, volatility context, reversal conditions, volume-informed zones and manually supplied options-positioning levels into one configurable workspace.
It is not built as a single automatic buy-and-sell system. Instead, it separates the trading process into several distinct questions:
Each part can be enabled independently. A user may run only one trend model and one impulse model for a clean chart, or enable the broader structure, reversal, order-block, volumetric and GEX toolsets when more contextual information is required.
The script is intended for discretionary analysis. It provides organised information and repeatable visual states, but it does not remove the need for risk management, market knowledge or independent judgement.
Design philosophy
Markets do not present every part of a trade at the same time.
A market may have a clear bullish trend but no immediate momentum expansion. It may produce a strong impulse directly into resistance. It may appear statistically extended without having changed its larger structure. It may also break an internal pivot while its broader swing structure remains intact.
For that reason, this module keeps several analytical functions separate:
The purpose is not to force every component into agreement. It is to make disagreement visible.
For example:
This separation allows the user to build a process rather than rely on a single coloured line.
What makes the module distinct
Several familiar technical concepts are available as optional models, including moving-average, Hull, ATR, relative-strength and structure-based methods. Those individual concepts are not presented as new inventions.
The protected value of the module is in how the complete framework is assembled and managed:
The module therefore does not depend on the novelty of any single classic indicator. Its purpose is to combine different forms of evidence into a consistent execution and analysis environment.
A practical workflow
A structured workflow may be:
The modules do not need to be enabled simultaneously. In many cases, a cleaner chart is preferable to displaying every available feature.
Trend models
The trend layer answers the question:
Which directional regime is currently dominant under the selected model?
Each model has a different balance between responsiveness, smoothness and confirmation. No model will be best in every market regime.

Universal Trend+
Universal Trend+ is a composite regime model.
Instead of depending on one crossover or one oscillator, it evaluates agreement across several different families of directional evidence. These include broader concepts such as:
The individual inputs are translated into comparable directional states before being combined into one persistent output.
This reduces dependence on a single type of calculation. A moving-average model may respond well in a smooth trend but struggle during compression. A momentum measure may react quickly but overstate temporary acceleration. A volatility-adjusted component may remain stable but respond later.
Universal Trend+ is designed to require broader directional agreement rather than treating any one family as sufficient by itself.
The plotted line acts as a visual carrier for the regime colour:
The exact component thresholds, state transitions and internal aggregation remain protected.
EMA Cross
EMA Cross provides the most familiar baseline trend model.
It compares a faster exponential average with a slower exponential average:
This option is included because it is transparent, responsive and easy to interpret.
Its limitation is equally well known: moving-average crosses can change state repeatedly during sideways markets. It is therefore useful as a simple reference model or for users who prefer conventional trend logic, but it should not be treated as equivalent to the protected composite models.
DEMA ATR
DEMA ATR combines a reduced-lag trend estimate with a volatility-aware trailing mechanism.
The DEMA component attempts to respond more quickly than a conventional EMA of similar apparent smoothness. The volatility layer then prevents the trend state from reacting to every minor movement in the underlying estimate.
Conceptually:
This model is useful when a trader wants a single trend boundary that accounts for current range conditions.
Like all volatility trails, it involves a compromise:
Relative Strength Overlay
Relative Strength Overlay converts an internal strength reading into a persistent directional state.
It is not used as a conventional overbought or oversold oscillator. Instead, the model evaluates how the current strength condition is distributed across a range of internal reference levels.
The result is a broader strength score rather than a decision based on one fixed midline.
This model is useful when the desired question is:
Has directional strength shifted far enough to establish a new state?
The plotted trend line changes colour when the internal strength score confirms a bullish or bearish transition. The state can persist through smaller fluctuations until an opposing condition is established.
Hull Trend
Hull Trend uses the Hull Moving Average as a responsive directional filter.
The Hull method was designed to reduce some of the lag normally associated with moving-average smoothing. The model colours according to whether the Hull estimate is rising or falling.
This makes it one of the faster and more visually direct options in the module.
Its strengths are:
Its weakness is that local slope changes can occur frequently in ranging conditions. It is therefore most useful when combined with structure, impulse or location rather than treated as a complete system by itself.
Composite Trend Trader
Composite Trend Trader is the broadest and most computationally intensive trend model in the script.
It evaluates agreement across multiple independently processed families of market behaviour, including:
Different components are normalised or converted into comparable directional assessments before being combined into a final persistent regime.
The purpose is to prevent one short-lived reading from controlling the entire model. A new state requires sufficient agreement across the internal framework.
This option can be useful when the user prefers a more selective composite view, but it will generally be heavier than the simpler models and may react later than a direct moving-average or Hull calculation.
The precise transformations, adaptive thresholds, component weights and confirmation rules remain protected.
Choosing a trend model
The models should not be judged only by how early they change colour.
Earlier models often produce more false transitions. Slower models often remain stable but surrender more of the initial move.
A practical selection guide is:
The appropriate choice depends on timeframe, market behaviour and how the user intends to combine it with the other modules.
Impulse models
Trend and impulse are deliberately separated.
Trend describes the current directional regime. Impulse identifies a change in pressure, expansion or initiative activity.
A market can remain bullish while its positive impulse has already faded. It can also produce a sharp positive impulse inside a larger bearish regime.

The impulse markers use two states:
The C marker should not automatically be interpreted as a short entry. It indicates that the prior positive impulse state has deteriorated under the selected model.
BBPct FL Impulse
BBPct FL Impulse evaluates where price sits within a volatility-adjusted distribution and then compares the resulting pressure state with its own recent history.
The model is designed to distinguish between:
Rather than firing on every band interaction, the internal state requires a broader persistence or ranking condition to be met.
A positive marker can therefore be read as a transition into stronger upside pressure. A cash marker indicates that this pressure state has weakened sufficiently to exit its prior condition.
This model is usually most useful when interpreted beside the selected trend model:
DM Impulse Enhanced
DM Impulse Enhanced is based on directional-movement behaviour processed through a comparative persistence framework.
It is designed to identify periods where directional expansion becomes meaningfully stronger relative to its recent behaviour, rather than relying only on an isolated directional-movement reading.
The model is useful for detecting:
As with the other impulse option, it should be used as timing context rather than a complete trade signal.
Using trend and impulse together
The most direct combinations are:
No combination guarantees continuation. The purpose is to show whether direction and timing are aligned.
Stop-loss reference methods
The stop-loss layer provides optional visual risk references.
These plots are not position-sizing tools and should not be treated as universal stop placements. A valid stop still depends on trade thesis, liquidity, timeframe, instrument behaviour and acceptable risk.

Dynamic
Dynamic mode plots a volatility-responsive upper and lower range around price.
The width expands when recent true range increases and contracts when conditions become quieter.
This can be useful for:
The bands should be treated as environmental references rather than automatic orders.
Fixed
Fixed mode displays several preset percentage offsets around the current reference price.
These can be used for:
A fixed percentage does not adapt to volatility. The same percentage may be excessive in a quiet instrument and too narrow in a highly volatile instrument.
Bar-to-Bar
Bar-to-Bar mode uses the prior candle’s relevant boundary as a short-horizon invalidation reference.
This is the tightest and most tactical option.
It may be appropriate for:
It is also highly sensitive to ordinary candle noise and can result in frequent invalidation.
Reversal Bands
The Reversal Bands are a separate statistical extension model designed to highlight areas where price has moved unusually far from its prevailing baseline.
They are not conventional fixed envelopes and are not intended to predict the exact high or low of a move.

The framework combines two broad forms of evidence:
A reversal signal requires both location and displacement conditions to align.
This is important because either condition alone may be insufficient:
By requiring agreement between the two, the model attempts to identify more meaningful extension events.
Band structure
The central upper and lower reversal boundaries mark the initial statistical extension area.
Additional outer layers are plotted beyond these boundaries to show progressively deeper displacement.
The gradient is designed to communicate degree rather than create several unrelated signals:
Dip and top markers
The optional markers identify bars where the protected reversal conditions are simultaneously satisfied.
These markers are best interpreted as areas requiring attention.
They may indicate:
They should not be treated as instructions to trade directly against a strong trend.
Using reversal bands with trend
The reversal framework becomes more informative when read beside the trend model.
Examples:
The bands measure extension. The trend and structure modules help determine whether that extension is being accepted, rejected or continued.
Market structure
The market-structure engine provides two independently configurable layers:
Each layer maintains its own active highs, lows and directional bias.
This prevents a local internal break from automatically being treated as a complete swing reversal.
Pivot confirmation
Structure is based on confirmed pivot points.
A pivot requires surrounding price information before it can be established. This means the turning bar is recognised only after the selected pivot depth has elapsed.
This is a necessary limitation of confirmed swing analysis:
The pivot should not be interpreted as having been known in real time on the original turning bar.
BOS and MSB
The module classifies confirmed structure breaks as:
The first valid break establishes the initial bias and is treated as a continuation-type event.
This classification provides more context than labelling every pivot break identically.
For example:
Break confirmation
The user can choose whether structure breaks are confirmed by:
Close confirmation is generally more selective.
Wick confirmation reacts earlier but will include more temporary penetrations and liquidity sweeps.
Internal and swing structure may also use different line styles, making the two scales visually distinct.
Fair Value Gaps
The Fair Value Gap module identifies three-candle imbalance regions where price moves strongly enough to leave an untraded interval between the first and third bars.
The user can choose:
FVGs are displayed as areas rather than single levels because the imbalance occupies a price range.
They may be used to study:
A fair value gap is not guaranteed support or resistance. Some gaps are filled immediately, some remain open for long periods, and some are crossed without reaction.
The module removes a zone after its defined fill condition has been met.
Volume-informed order blocks
The order-block engine is linked to the internal and swing structure systems.
Active zones can be created from:
The user can select which structure layer and event type should be allowed to create zones.

The engine identifies a source region associated with the movement leading into a confirmed structure break. That region is then stored and managed as an active bullish or bearish block.
The exact candidate-selection process remains protected, but the resulting zone contains:
Internal and swing blocks
Internal and swing blocks are displayed separately.
Internal blocks represent shorter-horizon structure and use a lighter visual treatment.
Swing blocks represent broader structure and use a stronger midpoint and border treatment.
This allows the user to distinguish between:
A local block inside a larger swing block may provide a more precise entry area, but the larger zone generally represents the broader context.
Source volume and visible share
When enabled, each projected block displays:
This is a relative comparison between displayed zones. It is not presented as an estimated buy-versus-sell split.
A higher share means the source candle contributed more volume relative to the other visible blocks in that channel. It does not guarantee that the zone will hold.
Tested-depth shading
The order-block engine records the deepest confirmed interaction with each active zone.
The tested portion is shaded separately from the untested portion.
This provides a direct visual representation of:
This is a measure of interaction depth, not a prediction that an untouched section must produce a reaction.
Midpoint and projection
Each block contains a midpoint reference.
The midpoint style differs between internal and swing zones so their structural scale remains identifiable.
Active zones are projected forward by a configurable number of bars. The projected region can be used to study:
Projection does not imply that price must return to the zone.
Mitigation methods
The user can choose between two mitigation rules:
Midpoint mitigation removes a zone sooner because a deeper test is not required.
Wick mitigation allows the block to remain active until its full outer boundary has been exceeded.
The correct choice depends on how strictly the user defines invalidation.
Volumetric support and resistance
The volumetric support and resistance module identifies pivot-based zones that also satisfy a relative-volume requirement.
Rather than drawing every pivot, it attempts to retain levels associated with more meaningful volume conditions.
The system includes controls for:
The output is displayed as a zone with ATR-scaled thickness rather than a single exact line.
This reflects the practical reality that support and resistance normally operate across an area.
Higher-volume events receive stronger visual emphasis.
The levels can be used for:
They are historical reference zones, not guaranteed barriers.
Gamma Exposure Levels
The GEX section converts a compatible text report into horizontal levels and optional regime shading.
It is important to understand what this module does and does not do:
The accuracy and usefulness of the output therefore depend entirely on the quality, compatibility and freshness of the pasted data.

Supported level families
The parser can display several categories when they are present in the supplied text.
All-expiry levels
These provide broader options-positioning context across the included expirations.
0DTE levels
These focus on same-day positioning and may be more relevant to intraday conditions.
Because 0DTE positioning can change quickly, stale input can become misleading.
Advanced levels
The module can also display:
These levels require careful interpretation.
Max Pain
Max Pain is the supplied strike where aggregate option-holder value is estimated to be minimised at expiration.
It should not be treated as a forecast or as a level price must reach. Its relevance can vary significantly with time to expiration, positioning changes and market movement.
Expected Move
The expected-move levels display the supplied upper and lower range.
They provide a reference for the magnitude of movement implied by the input data. They do not define hard support or resistance.
Flip zones
Flip zones identify supplied prices where gamma polarity changes.
Several zones may exist. Their importance may differ depending on the size and composition of the underlying positioning.
GEX Top 10
The user can optionally display ranked GEX strikes from:
Each rank can be enabled or disabled and assigned its own colour.
The parser uses the ranking included in the supplied report. It does not recalculate the ranking from raw options data.
Overlapping levels
Several GEX concepts may resolve to the same or nearly the same price.
Instead of plotting several unreadable labels on top of one another, the script combines nearby values into one level label.
For example, one price may simultaneously represent:
Combining these labels makes confluence visible without adding unnecessary chart clutter.
Using GEX with the technical modules
GEX levels are most useful as context rather than standalone signals.
Examples:
Because the GEX data is external and manually entered, it should be refreshed whenever the underlying report changes.
Suggested configurations
1. Clean trend-following mode
This produces the lightest and cleanest presentation.
2. Structure and execution mode
This configuration focuses on directional context and execution location.
3. Reversal and exhaustion mode
This helps distinguish a statistical extension from an actual structural reversal.
4. GEX context mode
5. Minimal price-action mode
This allows the script to function primarily as a structure and location toolkit.
Performance considerations
This is a large modular script.
The trend and stop components are relatively light, while the following features require more processing or drawing resources:
Users should enable only the modules needed for the current workflow.
Displaying every feature simultaneously may:
Summary
Trading Module is designed as a configurable analytical framework rather than a single black-box signal.
Its trend models establish directional state. Its impulse models identify changes in pressure. Its structure engine separates internal and swing continuation from potential regime shifts. Its FVG, order-block and volumetric modules provide location. Its reversal bands identify statistical extension. Its stop overlays provide optional risk references. Its GEX parser adds manually supplied options-positioning levels without pretending to calculate or source that data internally.
The intended use is confluence with clear separation of roles:
No individual component should be assumed to predict future price. The module is most useful when its different layers are used to build a consistent, testable and risk-aware decision process.

Overview
Trading Module is a modular visual decision-support overlay designed to bring directional analysis, momentum timing, market structure, volatility context, reversal conditions, volume-informed zones and manually supplied options-positioning levels into one configurable workspace.
It is not built as a single automatic buy-and-sell system. Instead, it separates the trading process into several distinct questions:
- What is the current directional bias?
- Is the market producing a meaningful impulse or expansion event?
- Where are the important structural levels and imbalances?
- Is price entering an unusually extended or reversal-prone area?
- Where could an existing trade idea become invalid?
- Are externally calculated gamma-exposure levels creating additional context?
Each part can be enabled independently. A user may run only one trend model and one impulse model for a clean chart, or enable the broader structure, reversal, order-block, volumetric and GEX toolsets when more contextual information is required.
The script is intended for discretionary analysis. It provides organised information and repeatable visual states, but it does not remove the need for risk management, market knowledge or independent judgement.
Design philosophy
Markets do not present every part of a trade at the same time.
A market may have a clear bullish trend but no immediate momentum expansion. It may produce a strong impulse directly into resistance. It may appear statistically extended without having changed its larger structure. It may also break an internal pivot while its broader swing structure remains intact.
For that reason, this module keeps several analytical functions separate:
- Trend defines the broader directional state.
- Impulse highlights changes in pressure and expansion.
- Market structure identifies confirmed continuation and shift events.
- FVGs, order blocks and volumetric levels provide location.
- Reversal bands identify unusually extended conditions.
- Stop-loss references provide optional invalidation frameworks.
- GEX levels add manually imported options-positioning context.
The purpose is not to force every component into agreement. It is to make disagreement visible.
For example:
- A bullish trend with bullish impulse in open space is different from a bullish impulse directly into swing resistance.
- A bearish internal structure break is different from a bearish break that also changes the swing structure.
- A reversal-band signal is different when it appears with trend exhaustion than when it appears during a strong continuation move.
- A technical breakout near a major supplied gamma level may require different expectations from the same breakout in an empty area.
This separation allows the user to build a process rather than rely on a single coloured line.
What makes the module distinct
Several familiar technical concepts are available as optional models, including moving-average, Hull, ATR, relative-strength and structure-based methods. Those individual concepts are not presented as new inventions.
The protected value of the module is in how the complete framework is assembled and managed:
- Multiple selectable trend models with different response characteristics.
- Protected composite models that combine several independent evidence families.
- Separate impulse-state models rather than treating trend and timing as the same calculation.
- Persistent state handling that avoids reducing every condition to a one-bar crossover.
- A statistical reversal framework with layered volatility-adjusted zones.
- Independent internal and swing market-structure engines.
- Structure-linked order blocks with source-volume information, projected regions, midpoint references and tested-depth visualisation.
- Persistent volumetric support and resistance zones.
- Multi-timeframe fair value gaps with controlled chart retention.
- A parser that converts compatible GEX text into organised chart levels and regime shading.
- A shared visual language that allows these tools to be combined without loading a separate script for each task.
The module therefore does not depend on the novelty of any single classic indicator. Its purpose is to combine different forms of evidence into a consistent execution and analysis environment.
A practical workflow
A structured workflow may be:
- Select a trend model to define the initial directional bias.
- Use an impulse model to determine whether pressure is currently expanding or contracting.
- Check internal and swing structure to identify whether price is continuing, transitioning or conflicting across scales.
- Map nearby FVGs, order blocks and volumetric support or resistance.
- Use the reversal bands to identify whether price is reaching an unusually extended area.
- Add GEX levels when compatible and sufficiently current external data is available.
- Choose an optional stop framework appropriate to the trade horizon.
The modules do not need to be enabled simultaneously. In many cases, a cleaner chart is preferable to displaying every available feature.
Trend models
The trend layer answers the question:
Which directional regime is currently dominant under the selected model?
Each model has a different balance between responsiveness, smoothness and confirmation. No model will be best in every market regime.
Universal Trend+
Universal Trend+ is a composite regime model.
Instead of depending on one crossover or one oscillator, it evaluates agreement across several different families of directional evidence. These include broader concepts such as:
- Relative strength.
- Momentum and rate of change.
- Directional separation.
- Smoothed trend state.
- Volatility-adjusted structure.
The individual inputs are translated into comparable directional states before being combined into one persistent output.
This reduces dependence on a single type of calculation. A moving-average model may respond well in a smooth trend but struggle during compression. A momentum measure may react quickly but overstate temporary acceleration. A volatility-adjusted component may remain stable but respond later.
Universal Trend+ is designed to require broader directional agreement rather than treating any one family as sufficient by itself.
The plotted line acts as a visual carrier for the regime colour:
- Bullish colour indicates positive composite alignment.
- Bearish colour indicates negative composite alignment.
- A neutral or unchanged state indicates that the model has not confirmed a new opposing regime.
The exact component thresholds, state transitions and internal aggregation remain protected.
EMA Cross
EMA Cross provides the most familiar baseline trend model.
It compares a faster exponential average with a slower exponential average:
- Fast average above slow average indicates bullish bias.
- Fast average below slow average indicates bearish bias.
This option is included because it is transparent, responsive and easy to interpret.
Its limitation is equally well known: moving-average crosses can change state repeatedly during sideways markets. It is therefore useful as a simple reference model or for users who prefer conventional trend logic, but it should not be treated as equivalent to the protected composite models.
DEMA ATR
DEMA ATR combines a reduced-lag trend estimate with a volatility-aware trailing mechanism.
The DEMA component attempts to respond more quickly than a conventional EMA of similar apparent smoothness. The volatility layer then prevents the trend state from reacting to every minor movement in the underlying estimate.
Conceptually:
- The DEMA provides the adaptive directional centre.
- The range component creates a movement threshold around that centre.
- The resulting line trails in one direction until sufficient movement forces it to change.
This model is useful when a trader wants a single trend boundary that accounts for current range conditions.
Like all volatility trails, it involves a compromise:
- Tighter behaviour reacts sooner but can produce more reversals.
- Wider behaviour is more stable but confirms changes later.
Relative Strength Overlay
Relative Strength Overlay converts an internal strength reading into a persistent directional state.
It is not used as a conventional overbought or oversold oscillator. Instead, the model evaluates how the current strength condition is distributed across a range of internal reference levels.
The result is a broader strength score rather than a decision based on one fixed midline.
This model is useful when the desired question is:
Has directional strength shifted far enough to establish a new state?
The plotted trend line changes colour when the internal strength score confirms a bullish or bearish transition. The state can persist through smaller fluctuations until an opposing condition is established.
Hull Trend
Hull Trend uses the Hull Moving Average as a responsive directional filter.
The Hull method was designed to reduce some of the lag normally associated with moving-average smoothing. The model colours according to whether the Hull estimate is rising or falling.
This makes it one of the faster and more visually direct options in the module.
Its strengths are:
- Smooth presentation.
- Responsive slope changes.
- Simple interpretation.
Its weakness is that local slope changes can occur frequently in ranging conditions. It is therefore most useful when combined with structure, impulse or location rather than treated as a complete system by itself.
Composite Trend Trader
Composite Trend Trader is the broadest and most computationally intensive trend model in the script.
It evaluates agreement across multiple independently processed families of market behaviour, including:
- Smoothed trend and momentum.
- Adaptive historical distributions.
- Relative displacement.
- Deviation and persistence.
- Filtered rate-of-change behaviour.
- Directional threshold states.
Different components are normalised or converted into comparable directional assessments before being combined into a final persistent regime.
The purpose is to prevent one short-lived reading from controlling the entire model. A new state requires sufficient agreement across the internal framework.
This option can be useful when the user prefers a more selective composite view, but it will generally be heavier than the simpler models and may react later than a direct moving-average or Hull calculation.
The precise transformations, adaptive thresholds, component weights and confirmation rules remain protected.
Choosing a trend model
The models should not be judged only by how early they change colour.
Earlier models often produce more false transitions. Slower models often remain stable but surrender more of the initial move.
A practical selection guide is:
- EMA Cross: conventional and transparent.
- Hull Trend: smooth and responsive.
- DEMA ATR: volatility-aware trailing structure.
- Relative Strength Overlay: persistent strength-based regime.
- Universal Trend+: moderate composite confirmation.
- Composite Trend Trader: broader and more selective composite state.
The appropriate choice depends on timeframe, market behaviour and how the user intends to combine it with the other modules.
Impulse models
Trend and impulse are deliberately separated.
Trend describes the current directional regime. Impulse identifies a change in pressure, expansion or initiative activity.
A market can remain bullish while its positive impulse has already faded. It can also produce a sharp positive impulse inside a larger bearish regime.
The impulse markers use two states:
- L represents a positive or long-side impulse condition.
- C represents a defensive or cash-state transition.
The C marker should not automatically be interpreted as a short entry. It indicates that the prior positive impulse state has deteriorated under the selected model.
BBPct FL Impulse
BBPct FL Impulse evaluates where price sits within a volatility-adjusted distribution and then compares the resulting pressure state with its own recent history.
The model is designed to distinguish between:
- Ordinary movement inside the prevailing distribution.
- Sustained pressure toward one side of the distribution.
- A meaningful deterioration from an established positive impulse.
Rather than firing on every band interaction, the internal state requires a broader persistence or ranking condition to be met.
A positive marker can therefore be read as a transition into stronger upside pressure. A cash marker indicates that this pressure state has weakened sufficiently to exit its prior condition.
This model is usually most useful when interpreted beside the selected trend model:
- Positive impulse with bullish trend supports directional alignment.
- Positive impulse with bearish trend may represent a squeeze or counter-trend event.
- A cash transition during a bullish trend may represent slowing momentum rather than a confirmed bearish reversal.
DM Impulse Enhanced
DM Impulse Enhanced is based on directional-movement behaviour processed through a comparative persistence framework.
It is designed to identify periods where directional expansion becomes meaningfully stronger relative to its recent behaviour, rather than relying only on an isolated directional-movement reading.
The model is useful for detecting:
- Initiation of directional pressure.
- Renewed momentum inside an existing trend.
- Failure of an established impulse state.
As with the other impulse option, it should be used as timing context rather than a complete trade signal.
Using trend and impulse together
The most direct combinations are:
- Bullish trend + positive impulse: directional alignment.
- Bullish trend + cash transition: bullish regime remains, but immediate expansion has weakened.
- Bearish trend + positive impulse: possible counter-trend squeeze or early transition.
- Trend change without impulse: directional model has shifted, but immediate pressure confirmation is absent.
No combination guarantees continuation. The purpose is to show whether direction and timing are aligned.
Stop-loss reference methods
The stop-loss layer provides optional visual risk references.
These plots are not position-sizing tools and should not be treated as universal stop placements. A valid stop still depends on trade thesis, liquidity, timeframe, instrument behaviour and acceptable risk.
Dynamic
Dynamic mode plots a volatility-responsive upper and lower range around price.
The width expands when recent true range increases and contracts when conditions become quieter.
This can be useful for:
- Allowing more room during volatile expansion.
- Avoiding a fixed-distance stop across different regimes.
- Visualising whether a proposed stop is unusually tight relative to recent movement.
The bands should be treated as environmental references rather than automatic orders.
Fixed
Fixed mode displays several preset percentage offsets around the current reference price.
These can be used for:
- Planning risk units.
- Comparing potential stop distances.
- Visualising scaling or invalidation bands.
- Maintaining consistent journalling rules.
A fixed percentage does not adapt to volatility. The same percentage may be excessive in a quiet instrument and too narrow in a highly volatile instrument.
Bar-to-Bar
Bar-to-Bar mode uses the prior candle’s relevant boundary as a short-horizon invalidation reference.
This is the tightest and most tactical option.
It may be appropriate for:
- Very short-duration trades.
- Immediate post-breakout management.
- Entries where the previous bar defines the thesis.
It is also highly sensitive to ordinary candle noise and can result in frequent invalidation.
Reversal Bands
The Reversal Bands are a separate statistical extension model designed to highlight areas where price has moved unusually far from its prevailing baseline.
They are not conventional fixed envelopes and are not intended to predict the exact high or low of a move.
The framework combines two broad forms of evidence:
- The current price extreme relative to its historical distribution.
- The current displacement relative to a volatility-adjusted baseline.
A reversal signal requires both location and displacement conditions to align.
This is important because either condition alone may be insufficient:
- A historically unusual low does not necessarily mean price is far from its current trend.
- A large deviation from a baseline does not necessarily mean the current low or high is statistically unusual.
By requiring agreement between the two, the model attempts to identify more meaningful extension events.
Band structure
The central upper and lower reversal boundaries mark the initial statistical extension area.
Additional outer layers are plotted beyond these boundaries to show progressively deeper displacement.
The gradient is designed to communicate degree rather than create several unrelated signals:
- The inner edge represents the first reversal-band threshold.
- The outer layers represent increasingly extended conditions.
- Price moving deeper into the gradient indicates greater deviation, not a guaranteed immediate reversal.
Dip and top markers
The optional markers identify bars where the protected reversal conditions are simultaneously satisfied.
- A bullish marker identifies a lower-side extension event.
- A bearish marker identifies an upper-side extension event.
These markers are best interpreted as areas requiring attention.
They may indicate:
- Potential exhaustion.
- A local mean-reversion opportunity.
- A period where continuation risk is becoming less favourable.
- The beginning of a consolidation rather than an immediate reversal.
They should not be treated as instructions to trade directly against a strong trend.
Using reversal bands with trend
The reversal framework becomes more informative when read beside the trend model.
Examples:
- A lower-band signal inside a bullish trend may identify a pullback or local exhaustion event.
- An upper-band signal inside a bearish trend may identify a counter-trend rally reaching an extended area.
- Repeated upper signals during a strong bullish trend may show persistent expansion rather than an immediately tradable top.
- A reversal signal accompanied by an opposing structure break carries different information from a signal with no structural change.
The bands measure extension. The trend and structure modules help determine whether that extension is being accepted, rejected or continued.
Market structure
The market-structure engine provides two independently configurable layers:
- Internal structure for shorter-horizon pivots and local changes.
- Swing structure for broader pivots and higher-level market organisation.
Each layer maintains its own active highs, lows and directional bias.
This prevents a local internal break from automatically being treated as a complete swing reversal.
Pivot confirmation
Structure is based on confirmed pivot points.
A pivot requires surrounding price information before it can be established. This means the turning bar is recognised only after the selected pivot depth has elapsed.
This is a necessary limitation of confirmed swing analysis:
- Lower pivot depths respond sooner but create more local structure.
- Higher pivot depths identify broader swings but confirm later.
The pivot should not be interpreted as having been known in real time on the original turning bar.
BOS and MSB
The module classifies confirmed structure breaks as:
- BOS — Break of Structure: a break continuing in the currently established directional bias.
- MSB — Market Structure Break: a break occurring against the established bias.
The first valid break establishes the initial bias and is treated as a continuation-type event.
This classification provides more context than labelling every pivot break identically.
For example:
- A bullish BOS during a bullish swing regime confirms continuation.
- A bearish internal MSB may warn that short-term structure is weakening.
- A bearish swing MSB represents a broader structural change than an internal event alone.
Break confirmation
The user can choose whether structure breaks are confirmed by:
- A completed candle close through the level.
- A completed candle wick through the level.
Close confirmation is generally more selective.
Wick confirmation reacts earlier but will include more temporary penetrations and liquidity sweeps.
Internal and swing structure may also use different line styles, making the two scales visually distinct.
Fair Value Gaps
The Fair Value Gap module identifies three-candle imbalance regions where price moves strongly enough to leave an untraded interval between the first and third bars.
The user can choose:
- Bullish gaps.
- Bearish gaps.
- Both directions.
- The chart timeframe or another timeframe.
- How many zones to retain.
- How far zones should extend.
FVGs are displayed as areas rather than single levels because the imbalance occupies a price range.
They may be used to study:
- Potential rebalancing areas.
- Retracement locations after displacement.
- Continuation zones.
- Areas where price previously moved with limited two-way trade.
A fair value gap is not guaranteed support or resistance. Some gaps are filled immediately, some remain open for long periods, and some are crossed without reaction.
The module removes a zone after its defined fill condition has been met.
Volume-informed order blocks
The order-block engine is linked to the internal and swing structure systems.
Active zones can be created from:
- Internal BOS events.
- Internal MSB events.
- Swing BOS events.
- Swing MSB events.
The user can select which structure layer and event type should be allowed to create zones.
The engine identifies a source region associated with the movement leading into a confirmed structure break. That region is then stored and managed as an active bullish or bearish block.
The exact candidate-selection process remains protected, but the resulting zone contains:
- An upper and lower boundary.
- A midpoint reference.
- The originating time.
- The volume associated with the selected source candle.
- A persistent record of how deeply price has tested the zone.
Internal and swing blocks
Internal and swing blocks are displayed separately.
Internal blocks represent shorter-horizon structure and use a lighter visual treatment.
Swing blocks represent broader structure and use a stronger midpoint and border treatment.
This allows the user to distinguish between:
- Local execution zones.
- Broader structural zones.
A local block inside a larger swing block may provide a more precise entry area, but the larger zone generally represents the broader context.
Source volume and visible share
When enabled, each projected block displays:
- The source volume associated with that block.
- Its percentage share of the currently visible volume within the same structural channel.
This is a relative comparison between displayed zones. It is not presented as an estimated buy-versus-sell split.
A higher share means the source candle contributed more volume relative to the other visible blocks in that channel. It does not guarantee that the zone will hold.
Tested-depth shading
The order-block engine records the deepest confirmed interaction with each active zone.
The tested portion is shaded separately from the untested portion.
This provides a direct visual representation of:
- How much of the block has already been traded into.
- How much of the original zone remains untested.
- Whether repeated interactions are gradually consuming the area.
This is a measure of interaction depth, not a prediction that an untouched section must produce a reaction.
Midpoint and projection
Each block contains a midpoint reference.
The midpoint style differs between internal and swing zones so their structural scale remains identifiable.
Active zones are projected forward by a configurable number of bars. The projected region can be used to study:
- Future retests.
- Potential invalidation areas.
- Liquidity interaction.
- Possible target or reaction context.
Projection does not imply that price must return to the zone.
Mitigation methods
The user can choose between two mitigation rules:
- Wick mitigation uses the outer block boundary.
- Midpoint mitigation uses the centre of the block.
Midpoint mitigation removes a zone sooner because a deeper test is not required.
Wick mitigation allows the block to remain active until its full outer boundary has been exceeded.
The correct choice depends on how strictly the user defines invalidation.
Volumetric support and resistance
The volumetric support and resistance module identifies pivot-based zones that also satisfy a relative-volume requirement.
Rather than drawing every pivot, it attempts to retain levels associated with more meaningful volume conditions.
The system includes controls for:
- Pivot sensitivity.
- Minimum relative-volume requirement.
- Analysis window.
- Maximum number of active levels.
- Minimum spacing between nearby zones.
- Removal after confirmed breaks.
- Optional forward extension.
The output is displayed as a zone with ATR-scaled thickness rather than a single exact line.
This reflects the practical reality that support and resistance normally operate across an area.
Higher-volume events receive stronger visual emphasis.
The levels can be used for:
- Locating potential reaction areas.
- Planning targets.
- Identifying whether an impulse is entering open space or established structure.
- Comparing technical trend signals with volume-supported locations.
They are historical reference zones, not guaranteed barriers.
Gamma Exposure Levels
The GEX section converts a compatible text report into horizontal levels and optional regime shading.
It is important to understand what this module does and does not do:
- It does not connect directly to an options exchange.
- It does not download options data.
- It does not independently calculate gamma exposure.
- It plots and organises values supplied by the user through the text input.
The accuracy and usefulness of the output therefore depend entirely on the quality, compatibility and freshness of the pasted data.
Supported level families
The parser can display several categories when they are present in the supplied text.
All-expiry levels
- High Volume Level.
- Call-side resistance.
- Put-side support.
These provide broader options-positioning context across the included expirations.
0DTE levels
- 0DTE High Volume Level.
- 0DTE call level.
- 0DTE put level.
These focus on same-day positioning and may be more relevant to intraday conditions.
Because 0DTE positioning can change quickly, stale input can become misleading.
Advanced levels
The module can also display:
- Max Pain.
- Expected Move upper and lower boundaries.
- Multiple gamma flip zones.
These levels require careful interpretation.
- A binary background on either side of Zero Gamma.
- A gradient whose intensity increases with distance from Zero Gamma.
Max Pain
Max Pain is the supplied strike where aggregate option-holder value is estimated to be minimised at expiration.
It should not be treated as a forecast or as a level price must reach. Its relevance can vary significantly with time to expiration, positioning changes and market movement.
Expected Move
The expected-move levels display the supplied upper and lower range.
They provide a reference for the magnitude of movement implied by the input data. They do not define hard support or resistance.
Flip zones
Flip zones identify supplied prices where gamma polarity changes.
Several zones may exist. Their importance may differ depending on the size and composition of the underlying positioning.
GEX Top 10
The user can optionally display ranked GEX strikes from:
- 0DTE data.
- All-expiry data.
- The first five levels only.
- The complete available top-ten set.
Each rank can be enabled or disabled and assigned its own colour.
The parser uses the ranking included in the supplied report. It does not recalculate the ranking from raw options data.
Overlapping levels
Several GEX concepts may resolve to the same or nearly the same price.
Instead of plotting several unreadable labels on top of one another, the script combines nearby values into one level label.
For example, one price may simultaneously represent:
- A call level.
- A high-volume level.
- A max-pain level.
Combining these labels makes confluence visible without adding unnecessary chart clutter.
Using GEX with the technical modules
GEX levels are most useful as context rather than standalone signals.
Examples:
- A bullish impulse approaching a major call-side level is different from the same impulse with no nearby supplied resistance.
- A reversal-band signal near an expected-move boundary may deserve greater attention than one near the middle of the supplied range.
- A structure break occurring below a supplied Zero Gamma level may behave differently from one occurring in a positive-gamma regime.
- An order block overlapping several supplied options levels creates a visible area of multi-method confluence.
Because the GEX data is external and manually entered, it should be refreshed whenever the underlying report changes.
Suggested configurations
1. Clean trend-following mode
- Select one trend model.
- Enable one impulse model.
- Use Dynamic stop references if required.
- Disable structure, gaps, blocks, volumetric levels and GEX.
This produces the lightest and cleanest presentation.
2. Structure and execution mode
- Select a trend model.
- Enable internal and swing structure.
- Show BOS and MSB events.
- Enable internal and swing order blocks.
- Display tested depth and source volume.
- Add FVGs and volumetric levels selectively.
This configuration focuses on directional context and execution location.
3. Reversal and exhaustion mode
- Select a slower trend model.
- Enable reversal bands and markers.
- Display internal structure.
- Use FVGs or volumetric zones for location.
This helps distinguish a statistical extension from an actual structural reversal.
4. GEX context mode
- Paste a current compatible GEX report.
- Display only the most relevant level families.
- Use a simple trend model to avoid clutter.
- Add Zero Gamma shading if required.
- Compare options levels with order blocks, FVGs or reversal bands.
5. Minimal price-action mode
- Disable trend and impulse models.
- Use swing and internal structure.
- Enable selected order-block channels.
- Display only a small number of FVGs and volumetric zones.
This allows the script to function primarily as a structure and location toolkit.
Performance considerations
This is a large modular script.
The trend and stop components are relatively light, while the following features require more processing or drawing resources:
- Composite Trend Trader.
- Multiple structure layers.
- Large pivot depths.
- Numerous order blocks.
- Tested-depth rendering.
- Multi-timeframe FVGs.
- Large numbers of volumetric zones.
- Many imported GEX levels and labels.
Users should enable only the modules needed for the current workflow.
Displaying every feature simultaneously may:
- Increase execution time.
- Create visual clutter.
- Make the important information harder to interpret.
- Approach TradingView drawing or processing limits on some configurations.
Summary
Trading Module is designed as a configurable analytical framework rather than a single black-box signal.
Its trend models establish directional state. Its impulse models identify changes in pressure. Its structure engine separates internal and swing continuation from potential regime shifts. Its FVG, order-block and volumetric modules provide location. Its reversal bands identify statistical extension. Its stop overlays provide optional risk references. Its GEX parser adds manually supplied options-positioning levels without pretending to calculate or source that data internally.
The intended use is confluence with clear separation of roles:
- Trend provides bias.
- Impulse provides timing context.
- Structure provides confirmation.
- Zones provide location.
- Reversal bands provide extension context.
- GEX provides an additional external positioning layer.
- Stops provide risk-reference frameworks.
No individual component should be assumed to predict future price. The module is most useful when its different layers are used to build a consistent, testable and risk-aware decision process.
Dostępne w Płatnej Przestrzeni
Ten wskaźnik jest dostępny wyłącznie dla subskrybentów Trading & Portfolio Toolkit. Dołącz, aby uzyskać dostęp do tego oraz innych skryptów autorstwa BackQuant.

Join the Paid Space or get access to my invite only scripts at
backquant.com/
Or join the free discord discord.gg/RmVrJV67yE
backquant.com/
Or join the free discord discord.gg/RmVrJV67yE
Wyłączenie odpowiedzialności
Informacje i publikacje nie stanowią i nie powinny być traktowane jako porady finansowe, inwestycyjne, tradingowe ani jakiekolwiek inne rekomendacje dostarczane lub zatwierdzone przez TradingView. Więcej informacji znajduje się w Warunkach użytkowania.
Dostępne w Płatnej Przestrzeni
Ten wskaźnik jest dostępny wyłącznie dla subskrybentów Trading & Portfolio Toolkit. Dołącz, aby uzyskać dostęp do tego oraz innych skryptów autorstwa BackQuant.
Join the Paid Space or get access to my invite only scripts at
backquant.com/
Or join the free discord discord.gg/RmVrJV67yE
backquant.com/
Or join the free discord discord.gg/RmVrJV67yE
Wyłączenie odpowiedzialności
Informacje i publikacje nie stanowią i nie powinny być traktowane jako porady finansowe, inwestycyjne, tradingowe ani jakiekolwiek inne rekomendacje dostarczane lub zatwierdzone przez TradingView. Więcej informacji znajduje się w Warunkach użytkowania.