OPEN-SOURCE SCRIPT
Volume & Volatility Pro Analyst Buy Vol: Sell Vol Ratio
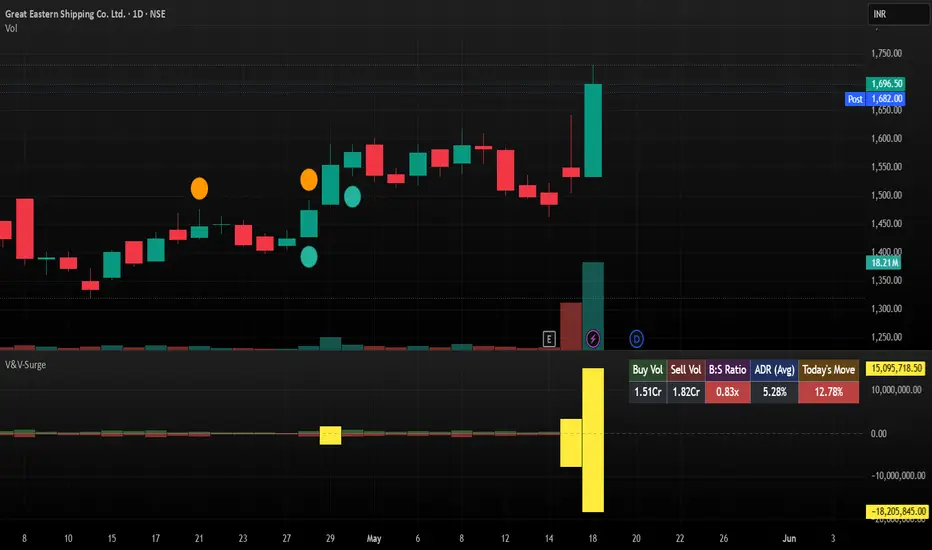
### Overview
The **Volume & Volatility Pro Analyst (V&V-Surge) ** is an all-in-one analysis tool designed to look beyond basic volume bars. Instead of coloring volume strictly by whether a candle closed up or down, this indicator breaks down the internal structure of each candlestick to isolate buying and selling pressure. It pairs volume diagnostics with an Intrinsic Daily Volatility matrix (ADR%) to evaluate market exhaustion and trend sustainability in real-time.
### Key Features
1. **Intraday Volume Breakdown: ** Deconstructs standard transaction volume into **Buy Volume** and **Sell Volume** by mathematically evaluating the candlestick's body size and wicks (lower wick pressure indicates buying; upper wick pressure indicates selling).
2. **Real-Time Buy: Sell Ratio (B:S):** A live updating quotient tracking dominant market participant control.
- A ratio **> 1.0x (Green)** indicates bulls are driving the order book.
- A ratio **< 1.0x (Red)** indicates bears are in absolute control.
3. **Institutional Volume Surge Warnings: ** Automatically flags institutional blocks or sudden retail frenzies when current volume surpasses an n-period average by a customizable multiplier (Default: 2x). Bars flash **Yellow** during surges.
4. **Volatility Exhaustion Matrix (ADR%): ** Compares the instrument's current intraday move percentage against its Average Daily Range percentage over a specified lookback.
- **Green Text/Cell: ** Current move is below the ADR limit (Room to run).
- **Red Text/Cell: ** Current move has exceeded normal statistical volatility limits (High probability of exhaustion or consolidation).
5. **Localization-Friendly Dashboard: ** Features an integrated toggle switch to format large numerical volume figures into either standard Western Notation (Billions/Millions) or Indian Financial Format (Crores/Lakhs).
### How to Trade with This Tool
- **Trend Confirmation: ** Look for a sustained breakout accompanied by a B:S ratio greater than 1.5x, accompanied by normal ADR levels.
- **Exhaustion Tells: ** If a massive breakout occurs, but "Today's Move" is deeply Red (Exceeding historical ADR%) while a Yellow "Volume Surge" bar prints, it strongly points toward a climax run or trap scenario rather than a clean entry point.
- **Reversal Signals: * * Watch for institutional volume surges (Yellow bars) forming on key support or resistance zones where the B:S ratio dramatically flips sides on sub-component timeframes.
### Disclaimer
Past performance does not guarantee future results. This tool is meant purely for quantitative visual aid and educational purposes. It does not constitute direct financial advice. Always practice strict risk management.
The **Volume & Volatility Pro Analyst (V&V-Surge) ** is an all-in-one analysis tool designed to look beyond basic volume bars. Instead of coloring volume strictly by whether a candle closed up or down, this indicator breaks down the internal structure of each candlestick to isolate buying and selling pressure. It pairs volume diagnostics with an Intrinsic Daily Volatility matrix (ADR%) to evaluate market exhaustion and trend sustainability in real-time.
### Key Features
1. **Intraday Volume Breakdown: ** Deconstructs standard transaction volume into **Buy Volume** and **Sell Volume** by mathematically evaluating the candlestick's body size and wicks (lower wick pressure indicates buying; upper wick pressure indicates selling).
2. **Real-Time Buy: Sell Ratio (B:S):** A live updating quotient tracking dominant market participant control.
- A ratio **> 1.0x (Green)** indicates bulls are driving the order book.
- A ratio **< 1.0x (Red)** indicates bears are in absolute control.
3. **Institutional Volume Surge Warnings: ** Automatically flags institutional blocks or sudden retail frenzies when current volume surpasses an n-period average by a customizable multiplier (Default: 2x). Bars flash **Yellow** during surges.
4. **Volatility Exhaustion Matrix (ADR%): ** Compares the instrument's current intraday move percentage against its Average Daily Range percentage over a specified lookback.
- **Green Text/Cell: ** Current move is below the ADR limit (Room to run).
- **Red Text/Cell: ** Current move has exceeded normal statistical volatility limits (High probability of exhaustion or consolidation).
5. **Localization-Friendly Dashboard: ** Features an integrated toggle switch to format large numerical volume figures into either standard Western Notation (Billions/Millions) or Indian Financial Format (Crores/Lakhs).
### How to Trade with This Tool
- **Trend Confirmation: ** Look for a sustained breakout accompanied by a B:S ratio greater than 1.5x, accompanied by normal ADR levels.
- **Exhaustion Tells: ** If a massive breakout occurs, but "Today's Move" is deeply Red (Exceeding historical ADR%) while a Yellow "Volume Surge" bar prints, it strongly points toward a climax run or trap scenario rather than a clean entry point.
- **Reversal Signals: *
### Disclaimer
Past performance does not guarantee future results. This tool is meant purely for quantitative visual aid and educational purposes. It does not constitute direct financial advice. Always practice strict risk management.
Skrypt open-source
W zgodzie z duchem TradingView twórca tego skryptu udostępnił go jako open-source, aby użytkownicy mogli przejrzeć i zweryfikować jego działanie. Ukłony dla autora. Korzystanie jest bezpłatne, jednak ponowna publikacja kodu podlega naszym Zasadom serwisu.

Wyłączenie odpowiedzialności
Informacje i publikacje nie stanowią i nie powinny być traktowane jako porady finansowe, inwestycyjne, tradingowe ani jakiekolwiek inne rekomendacje dostarczane lub zatwierdzone przez TradingView. Więcej informacji znajduje się w Warunkach użytkowania.
Skrypt open-source
W zgodzie z duchem TradingView twórca tego skryptu udostępnił go jako open-source, aby użytkownicy mogli przejrzeć i zweryfikować jego działanie. Ukłony dla autora. Korzystanie jest bezpłatne, jednak ponowna publikacja kodu podlega naszym Zasadom serwisu.
Wyłączenie odpowiedzialności
Informacje i publikacje nie stanowią i nie powinny być traktowane jako porady finansowe, inwestycyjne, tradingowe ani jakiekolwiek inne rekomendacje dostarczane lub zatwierdzone przez TradingView. Więcej informacji znajduje się w Warunkach użytkowania.