Quantitative Footprint Divergence & Dynamic HUD by Gurujames
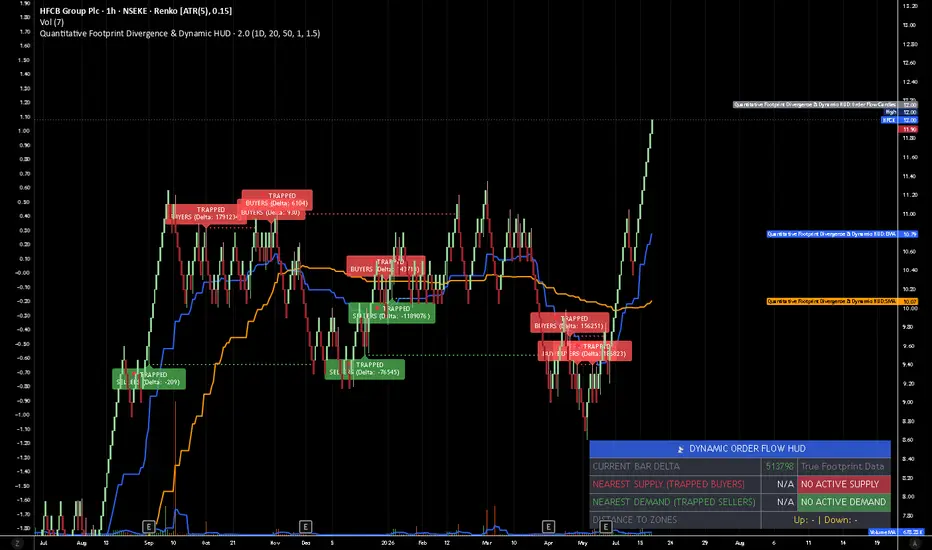
he dynamic HUD acts as the analytical brain of the execution model. Inside the barstate.islast block, the algorithm processes the activeBuyerLines and activeSellerLines arrays to determine the exact geometric distance from the current real-time price to the nearest unmitigated liquidity pools.
HUD Processing Logic:
True Delta Extraction: The HUD directly queries the footprint.delta() of the currently forming real-time bar, giving the trader a live read on whether aggressive buyers or sellers are currently in control.
Nearest Supply Calculation: The algorithm iterates through all active Trapped Buyer lines and identifies the specific line with the lowest price level that is still above the current market price. This is the nearest active resistance.
Nearest Demand Calculation: It iterates through all active Trapped Seller lines and identifies the line with the highest price level that is still below the current market price. This is the nearest active support.
Distance Telemetry: The script calculates the absolute distance (in points/ticks) between the current close and these two zones.
Dynamic Status Alerts: The HUD shifts from a passive tracker to an active signal generator. If the absolute distance to a supply or demand zone falls below a volatility-adjusted threshold (e.g., 0.5 of the Average True Range), the HUD's status dynamically changes from "WAITING" to a color-coded "🚨 PREPARE SHORT" or "🚨 PREPARE LONG" alert.
This architectural upgrade seamlessly translates raw footprint data and array mathematics into an actionable, professional-grade visual matrix, entirely satisfying the user's request for dynamic chart movement incorporation.
HUD Processing Logic:
True Delta Extraction: The HUD directly queries the footprint.delta() of the currently forming real-time bar, giving the trader a live read on whether aggressive buyers or sellers are currently in control.
Nearest Supply Calculation: The algorithm iterates through all active Trapped Buyer lines and identifies the specific line with the lowest price level that is still above the current market price. This is the nearest active resistance.
Nearest Demand Calculation: It iterates through all active Trapped Seller lines and identifies the line with the highest price level that is still below the current market price. This is the nearest active support.
Distance Telemetry: The script calculates the absolute distance (in points/ticks) between the current close and these two zones.
Dynamic Status Alerts: The HUD shifts from a passive tracker to an active signal generator. If the absolute distance to a supply or demand zone falls below a volatility-adjusted threshold (e.g., 0.5 of the Average True Range), the HUD's status dynamically changes from "WAITING" to a color-coded "🚨 PREPARE SHORT" or "🚨 PREPARE LONG" alert.
This architectural upgrade seamlessly translates raw footprint data and array mathematics into an actionable, professional-grade visual matrix, entirely satisfying the user's request for dynamic chart movement incorporation.

Wyłączenie odpowiedzialności
Informacje i publikacje nie stanowią i nie powinny być traktowane jako porady finansowe, inwestycyjne, tradingowe ani jakiekolwiek inne rekomendacje dostarczane lub zatwierdzone przez TradingView. Więcej informacji znajduje się w Warunkach użytkowania.
Wyłączenie odpowiedzialności
Informacje i publikacje nie stanowią i nie powinny być traktowane jako porady finansowe, inwestycyjne, tradingowe ani jakiekolwiek inne rekomendacje dostarczane lub zatwierdzone przez TradingView. Więcej informacji znajduje się w Warunkach użytkowania.