OPEN-SOURCE SCRIPT
Bastion Ledger [JOAT]
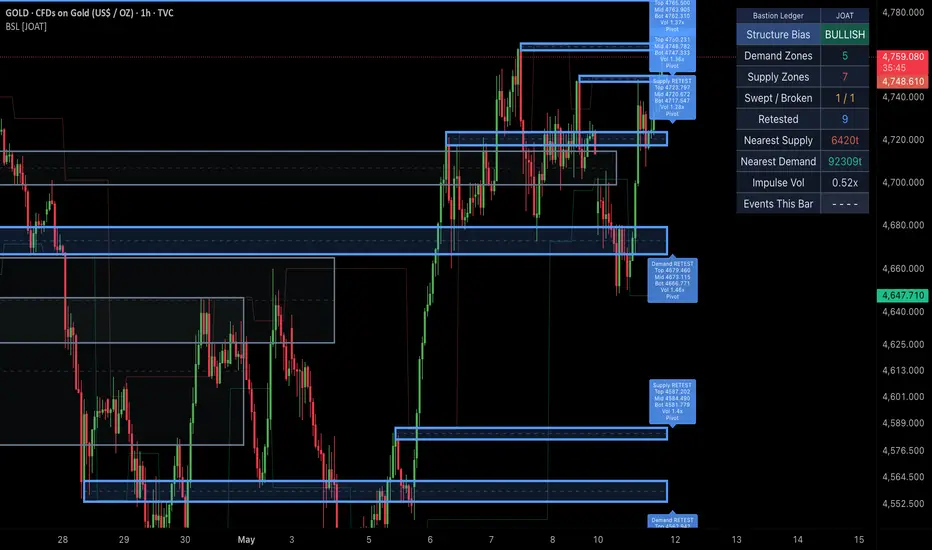
Bastion Ledger [JOAT]
Introduction
Bastion Ledger is an open-source liquidity and structure overlay designed to track active demand and supply zones through a full lifecycle model. The script builds zones from confirmed pivots and volume impulse events, then tracks how price interacts with those zones over time through active, swept, broken, retested, and archived states.
The problem Bastion Ledger solves is zone ambiguity. Many support and resistance tools simply draw a level and leave interpretation to the user. Bastion Ledger adds structure to that process by classifying how each zone was created and what has happened to it since. This makes the chart easier to read and gives the user a cleaner framework for identifying whether liquidity has held, been swept, failed, or transitioned into a retest state.

Core Concepts
1. Confirmed Pivot Structure
Zones created from pivots only appear after pivot confirmation. This introduces natural delay by design, but it prevents the script from creating forward-looking structure that disappears later.
2. Volume-Impulse Zone Creation
The script can also create zones from candles that exhibit high relative volume and efficient directional body behavior. This allows the overlay to capture not only swing structure but also displacement-origin areas.
3. Zone Lifecycle Model
Each zone progresses through a clear state model:
This is one of the defining features of the script. Instead of leaving historical rectangles behind with no context, the overlay tracks what has happened to each one.
4. Midpoint and Structure Rails
Every zone can include a midpoint reference and supporting structure rails to make reaction areas easier to inspect. This helps distinguish edge reactions from deeper zone acceptance.
5. Dashboard Context
The top-right dashboard summarizes active counts, nearest demand and supply distance, event state, and structure bias so the user can quickly orient themselves.
Features
How to Use This Indicator
Step 1: Identify the Nearest Active Zone
Use the plotted boxes and dashboard distance readouts to locate the nearest demand and supply area.
Step 2: Read the Zone State
An active zone is different from a swept or broken zone. The lifecycle state tells you whether the zone is still intact or has already lost integrity.
Step 3: Watch Retests After Breaks
Retested zones can be especially useful because they represent a transition from defended liquidity to broken structure and then a recheck of that failure.
Step 4: Combine with Regime Context
Bastion Ledger works best when combined with a separate trend or regime filter. Use it to map where reactions matter, not to replace directional context.
Indicator Limitations
Originality Statement
Bastion Ledger is original in its combination of pivot structure, volume-impulse zone creation, and lifecycle classification. The script is not just a rectangle drawer. Its core value lies in tracking how a zone evolves after creation and presenting that evolution in a consistent institutional overlay.
Disclaimer
This indicator is provided for educational and informational purposes only. It is not financial advice. Liquidity zones are interpretive tools based on historical price and volume behavior and do not guarantee future reactions.
- Made with passion by jackofalltrades
Introduction
Bastion Ledger is an open-source liquidity and structure overlay designed to track active demand and supply zones through a full lifecycle model. The script builds zones from confirmed pivots and volume impulse events, then tracks how price interacts with those zones over time through active, swept, broken, retested, and archived states.
The problem Bastion Ledger solves is zone ambiguity. Many support and resistance tools simply draw a level and leave interpretation to the user. Bastion Ledger adds structure to that process by classifying how each zone was created and what has happened to it since. This makes the chart easier to read and gives the user a cleaner framework for identifying whether liquidity has held, been swept, failed, or transitioned into a retest state.
Core Concepts
1. Confirmed Pivot Structure
Zones created from pivots only appear after pivot confirmation. This introduces natural delay by design, but it prevents the script from creating forward-looking structure that disappears later.
2. Volume-Impulse Zone Creation
The script can also create zones from candles that exhibit high relative volume and efficient directional body behavior. This allows the overlay to capture not only swing structure but also displacement-origin areas.
3. Zone Lifecycle Model
Each zone progresses through a clear state model:
- ACTIVE
- SWEEPED
- BROKEN
- RETESTED
- ARCHIVED
This is one of the defining features of the script. Instead of leaving historical rectangles behind with no context, the overlay tracks what has happened to each one.
4. Midpoint and Structure Rails
Every zone can include a midpoint reference and supporting structure rails to make reaction areas easier to inspect. This helps distinguish edge reactions from deeper zone acceptance.
5. Dashboard Context
The top-right dashboard summarizes active counts, nearest demand and supply distance, event state, and structure bias so the user can quickly orient themselves.
Features
- Dual-source zone creation: Confirmed pivots and volume impulse zones
- Stateful zone lifecycle: Tracks sweeps, breaks, retests, and archival
- ATR-aware zone sizing: Zone height adapts to market conditions
- Object-efficient rendering: Uses persistent objects with setter updates
- Midpoint lines: Helps judge reaction depth inside each zone
- Structure bias readout: Gives a quick demand-versus-supply view
- Nearest-zone distance readout: Useful for contextual planning
- Top-right dashboard: Medium-size summary panel
- Confirmed-bar event logic: Creation and transitions are handled safely
- Alertconditions: Zone create, sweep, break, retest, and structure breaks
How to Use This Indicator
Step 1: Identify the Nearest Active Zone
Use the plotted boxes and dashboard distance readouts to locate the nearest demand and supply area.
Step 2: Read the Zone State
An active zone is different from a swept or broken zone. The lifecycle state tells you whether the zone is still intact or has already lost integrity.
Step 3: Watch Retests After Breaks
Retested zones can be especially useful because they represent a transition from defended liquidity to broken structure and then a recheck of that failure.
Step 4: Combine with Regime Context
Bastion Ledger works best when combined with a separate trend or regime filter. Use it to map where reactions matter, not to replace directional context.
Indicator Limitations
- Pivot-based zones confirm after the pivot completes, which is intentional non-repainting behavior
- Very fast markets can move through multiple zone states in a short number of bars
- Zone relevance declines over time, so older archived zones should not be treated like fresh liquidity
- This script tracks structural interaction, not order flow or real exchange-level liquidity
Originality Statement
Bastion Ledger is original in its combination of pivot structure, volume-impulse zone creation, and lifecycle classification. The script is not just a rectangle drawer. Its core value lies in tracking how a zone evolves after creation and presenting that evolution in a consistent institutional overlay.
Disclaimer
This indicator is provided for educational and informational purposes only. It is not financial advice. Liquidity zones are interpretive tools based on historical price and volume behavior and do not guarantee future reactions.
- Made with passion by jackofalltrades
Skrypt open-source
W zgodzie z duchem TradingView twórca tego skryptu udostępnił go jako open-source, aby użytkownicy mogli przejrzeć i zweryfikować jego działanie. Ukłony dla autora. Korzystanie jest bezpłatne, jednak ponowna publikacja kodu podlega naszym Zasadom serwisu.

The Institutional Grade Trading Ecosystem, Built to win trades 📈
Get Access 👇
jackofalltrades.vip 🌐
t.me/jackofalltradesvip 🃏
Get Access 👇
jackofalltrades.vip 🌐
t.me/jackofalltradesvip 🃏
Wyłączenie odpowiedzialności
Informacje i publikacje nie stanowią i nie powinny być traktowane jako porady finansowe, inwestycyjne, tradingowe ani jakiekolwiek inne rekomendacje dostarczane lub zatwierdzone przez TradingView. Więcej informacji znajduje się w Warunkach użytkowania.
Skrypt open-source
W zgodzie z duchem TradingView twórca tego skryptu udostępnił go jako open-source, aby użytkownicy mogli przejrzeć i zweryfikować jego działanie. Ukłony dla autora. Korzystanie jest bezpłatne, jednak ponowna publikacja kodu podlega naszym Zasadom serwisu.
The Institutional Grade Trading Ecosystem, Built to win trades 📈
Get Access 👇
jackofalltrades.vip 🌐
t.me/jackofalltradesvip 🃏
Get Access 👇
jackofalltrades.vip 🌐
t.me/jackofalltradesvip 🃏
Wyłączenie odpowiedzialności
Informacje i publikacje nie stanowią i nie powinny być traktowane jako porady finansowe, inwestycyjne, tradingowe ani jakiekolwiek inne rekomendacje dostarczane lub zatwierdzone przez TradingView. Więcej informacji znajduje się w Warunkach użytkowania.