OPEN-SOURCE SCRIPT
Zaktualizowano Multi-Asset SuperTrend Map [BigBeluga]
🔵 OVERVIEW
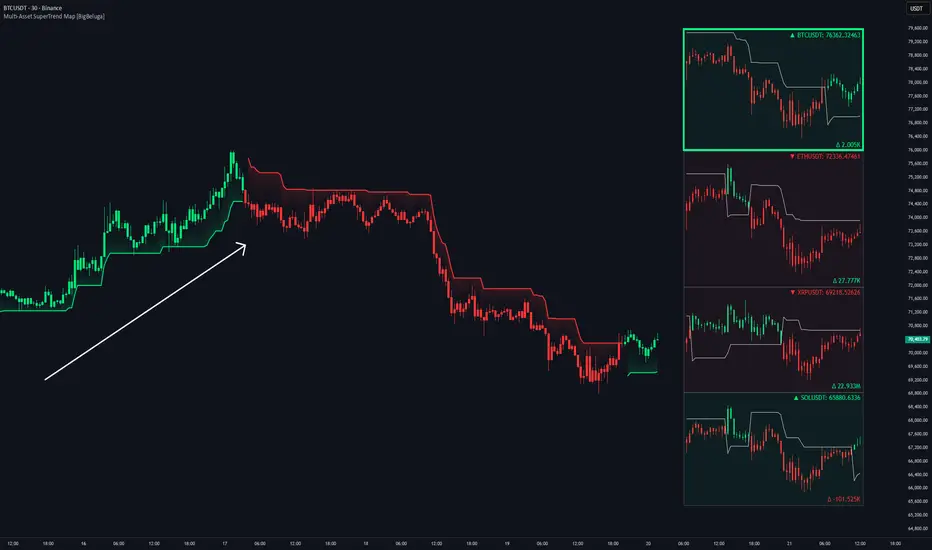
Multi-Asset SuperTrend Map [BigBeluga] is a comparative market-structure visualization tool that displays multiple assets side-by-side using a unified SuperTrend framework.
Instead of switching charts or stacking indicators, this tool compresses several markets into a single view, allowing traders to instantly assess trend direction, volatility alignment, and volume pressure across assets.

Each asset is reconstructed as a scaled synthetic candle stream, aligned to the current chart’s volatility, and overlaid with its own SuperTrend logic.
🔵 CORE CONCEPT
🔵 CALCULATION & LOGIC
1. SuperTrend Engine
2. Multi-Asset Scaling Logic
3. Synthetic Candle Reconstruction
4. SuperTrend Mapping
5. Delta Volume Aggregation
🔵 VISUAL STRUCTURE
⚠️MARKET SESSION BEHAVIOR
🔵 HOW TO USE
🔵 CONCLUSION
Multi-Asset SuperTrend Map [BigBeluga] transforms SuperTrend from a single-market indicator into a cross-market decision framework.
By normalizing volatility, synchronizing time, and adding volume delta context, it enables traders to evaluate trend quality, alignment, and participation across assets — all from one chart.
This makes it especially powerful for crypto pairs, index baskets, and correlated markets where relative behavior matters as much as absolute price direction.
Multi-Asset SuperTrend Map [BigBeluga] is a comparative market-structure visualization tool that displays multiple assets side-by-side using a unified SuperTrend framework.
Instead of switching charts or stacking indicators, this tool compresses several markets into a single view, allowing traders to instantly assess trend direction, volatility alignment, and volume pressure across assets.
Each asset is reconstructed as a scaled synthetic candle stream, aligned to the current chart’s volatility, and overlaid with its own SuperTrend logic.
🔵 CORE CONCEPT
- SuperTrend as Regime Filter — Each asset uses the same ATR-based SuperTrend logic to determine bullish or bearish state.
- Volatility Normalization — Assets are scaled using ATR ratios so high-price and low-price symbols can be compared visually on one chart.
- Synchronized Time Axis — All assets are plotted on the current chart timeframe, enabling true bar-to-bar comparison.
- Trend + Delta Context — In addition to trend direction, the indicator aggregates directional volume (delta) to reveal participation strength.
🔵 CALCULATION & LOGIC
1. SuperTrend Engine
- The indicator uses TradingView’s native SuperTrend calculation:
Pine Script® - ATR Length controls volatility smoothing.
- ATR Factor defines band width and trend sensitivity.
- Trend direction is binary:
- Bullish when price is above the SuperTrend line.
- Bearish when price is below the SuperTrend line.
2. Multi-Asset Scaling Logic
- Each external symbol is fetched using request.security().
- ATR is calculated both on the chart symbol and the external symbol.
- A scaling coefficient is derived:
- chart ATR ÷ symbol ATR
Pine Script® - All OHLC values are remapped so different assets share a comparable vertical range.
3. Synthetic Candle Reconstruction
- Each asset is redrawn using:
- Vertical lines for wicks
- Thick lines for candle bodies
- Candle color logic:
- Trend-based (SuperTrend direction) if enabled
- Otherwise standard bullish/bearish candle logic
- Trend-based (SuperTrend direction) if enabled
4. SuperTrend Mapping
- The SuperTrend line for each asset is remapped and drawn as a polyline.
- This allows trend curvature and regime shifts to be compared visually across symbols.
5. Delta Volume Aggregation
- Directional volume is accumulated:
- Volume added when close > open
- Volume subtracted when close < open
- Delta is displayed per asset, showing whether bullish or bearish participation dominates.
🔵 VISUAL STRUCTURE
- Each asset is wrapped inside a bounding box representing its full recent range.
- Background color reflects current trend direction (bullish or bearish).
- Asset label displays:
- Symbol name
- Current price
- Trend direction arrow (▲ / ▼)
- Delta volume is displayed beneath the asset block for flow context.
⚠️MARKET SESSION BEHAVIOR
- On lower timeframes (e.g. 1m–12h), traditional stock markets are closed during weekends.
- During these periods, price data may appear as flat or static candles with minimal or no movement.
- This is expected behavior and reflects the absence of active trading, not a calculation error.
- Crypto markets remain unaffected and continue updating normally.
🔵 HOW TO USE
- Compare trend alignment across correlated markets (e.g., BTC vs ETH).
- Identify relative strength when one asset trends while others stall.
- Use delta volume to confirm whether trends are supported by participation.
- Spot early divergence when price trends align but delta disagrees.
- Combine with higher-timeframe structure or liquidity tools for execution.
🔵 CONCLUSION
Multi-Asset SuperTrend Map [BigBeluga] transforms SuperTrend from a single-market indicator into a cross-market decision framework.
By normalizing volatility, synchronizing time, and adding volume delta context, it enables traders to evaluate trend quality, alignment, and participation across assets — all from one chart.
This makes it especially powerful for crypto pairs, index baskets, and correlated markets where relative behavior matters as much as absolute price direction.
Informacje o Wersji
- Price value fixSkrypt open-source
W zgodzie z duchem TradingView twórca tego skryptu udostępnił go jako open-source, aby użytkownicy mogli przejrzeć i zweryfikować jego działanie. Ukłony dla autora. Korzystanie jest bezpłatne, jednak ponowna publikacja kodu podlega naszym Zasadom serwisu.

🌐 bigbeluga.org/tv - Get access to our powerful tools & indicators.
🔵 Learn More -> docs.bigbeluga.org/
🔵 Join Discord -> go.bigbeluga.org/k65q9bfqfu
All content provided by BigBeluga is for educational purposes only
🔵 Learn More -> docs.bigbeluga.org/
🔵 Join Discord -> go.bigbeluga.org/k65q9bfqfu
All content provided by BigBeluga is for educational purposes only
Wyłączenie odpowiedzialności
Informacje i publikacje nie stanowią i nie powinny być traktowane jako porady finansowe, inwestycyjne, tradingowe ani jakiekolwiek inne rekomendacje dostarczane lub zatwierdzone przez TradingView. Więcej informacji znajduje się w Warunkach użytkowania.
Skrypt open-source
W zgodzie z duchem TradingView twórca tego skryptu udostępnił go jako open-source, aby użytkownicy mogli przejrzeć i zweryfikować jego działanie. Ukłony dla autora. Korzystanie jest bezpłatne, jednak ponowna publikacja kodu podlega naszym Zasadom serwisu.
🌐 bigbeluga.org/tv - Get access to our powerful tools & indicators.
🔵 Learn More -> docs.bigbeluga.org/
🔵 Join Discord -> go.bigbeluga.org/k65q9bfqfu
All content provided by BigBeluga is for educational purposes only
🔵 Learn More -> docs.bigbeluga.org/
🔵 Join Discord -> go.bigbeluga.org/k65q9bfqfu
All content provided by BigBeluga is for educational purposes only
Wyłączenie odpowiedzialności
Informacje i publikacje nie stanowią i nie powinny być traktowane jako porady finansowe, inwestycyjne, tradingowe ani jakiekolwiek inne rekomendacje dostarczane lub zatwierdzone przez TradingView. Więcej informacji znajduje się w Warunkach użytkowania.