OPEN-SOURCE SCRIPT
Zaktualizowano Key Intraday Levels
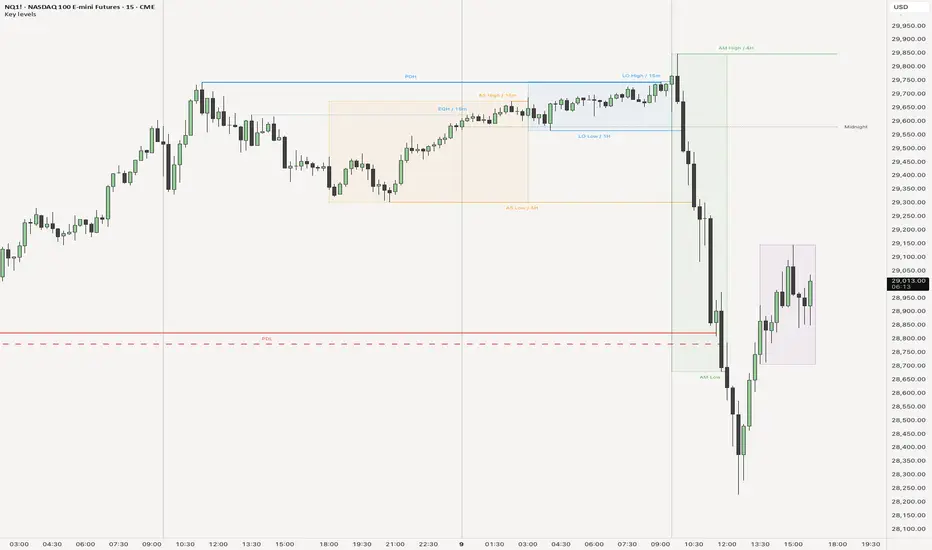
Key Intraday Levels
A clean, all-in-one overlay for ICT and SMC traders. Plots every key intraday reference prices — session boxes, opening prices, and previous day/week highs and lows — without cluttering your chart with multiple separate indicators.
What it does
🟧 Session Boxes
Highlights the price range of up to 5 trading sessions directly on your chart:
- Asian Range (default 18:00 – 03:00 ET)
- London (default 02:00 – 05:00 ET)
- NY AM (default 09:30 – 12:00 ET)
- Lunch Hour (optional, default off)
- NY PM (optional, default off)
Each box has its own color, and the start/end times are fully configurable in 15-minute increments. Boxes automatically hide on timeframes above 1H to keep higher timeframe charts clean. At 6pm ET (CME daily rollover), the previous day's boxes fade out — you control how many prior days stay visible.
📐 Key Liquidity Lines
Once a session closes, the indicator draws a horizontal line extending from the **exact candle** where that session's High or Low was formed. These are the liquidity levels price tends to return to.
- Lines extend forward until price **takes the level**, then freeze in place
- A configurable grace period lets the line extend a few candles past the take before stopping
- Each session (Asian, London, NY AM, Lunch, NY PM) has its own visibility toggle
- Labels sit **above** High lines and **below** Low lines, showing the session name (e.g. *AS High*, *LO Low*, *AM High*) and optionally the exact price
- Label position (Left / Center / Right) controls where along the line the text is anchored
📌 Opens
Marks three key opening prices with a vertical line and an optional horizontal level extending forward:
- Midnight Open — start of the new CME trading day
- 8:30 Open — pre-market economic release time (optional, default off)
- 9:30am Open — NYSE/equities open
Each open has independent color, style, and width. Labels (*Midnight*, *8:30am*, *9:30am*) appear to the right of the horizontal level. Like session boxes, opens from prior days fade out at 6pm ET — previous days show only the vertical line, keeping your chart focused on the most recent levels.
📊 Daily & Weekly Levels
Plots the four most-watched higher timeframe reference levels:
- PDH — Previous Day High (blue solid)
- PDL — Previous Day Low (red solid)
- PWH — Previous Week High (blue dashed)
- PWL — Previous Week Low (red dashed)
Lines start from the bar where the extreme was actually formed, not from the session open. They freeze when price takes the level, with an optional candle grace period. Labels show the level name and price.
Timezone: The indicator defaults to New York (ET). If your chart is set to a different timezone, adjust the Timezone setting to match so session detection stays accurate.
A clean, all-in-one overlay for ICT and SMC traders. Plots every key intraday reference prices — session boxes, opening prices, and previous day/week highs and lows — without cluttering your chart with multiple separate indicators.
What it does
🟧 Session Boxes
Highlights the price range of up to 5 trading sessions directly on your chart:
- Asian Range (default 18:00 – 03:00 ET)
- London (default 02:00 – 05:00 ET)
- NY AM (default 09:30 – 12:00 ET)
- Lunch Hour (optional, default off)
- NY PM (optional, default off)
Each box has its own color, and the start/end times are fully configurable in 15-minute increments. Boxes automatically hide on timeframes above 1H to keep higher timeframe charts clean. At 6pm ET (CME daily rollover), the previous day's boxes fade out — you control how many prior days stay visible.
📐 Key Liquidity Lines
Once a session closes, the indicator draws a horizontal line extending from the **exact candle** where that session's High or Low was formed. These are the liquidity levels price tends to return to.
- Lines extend forward until price **takes the level**, then freeze in place
- A configurable grace period lets the line extend a few candles past the take before stopping
- Each session (Asian, London, NY AM, Lunch, NY PM) has its own visibility toggle
- Labels sit **above** High lines and **below** Low lines, showing the session name (e.g. *AS High*, *LO Low*, *AM High*) and optionally the exact price
- Label position (Left / Center / Right) controls where along the line the text is anchored
📌 Opens
Marks three key opening prices with a vertical line and an optional horizontal level extending forward:
- Midnight Open — start of the new CME trading day
- 8:30 Open — pre-market economic release time (optional, default off)
- 9:30am Open — NYSE/equities open
Each open has independent color, style, and width. Labels (*Midnight*, *8:30am*, *9:30am*) appear to the right of the horizontal level. Like session boxes, opens from prior days fade out at 6pm ET — previous days show only the vertical line, keeping your chart focused on the most recent levels.
📊 Daily & Weekly Levels
Plots the four most-watched higher timeframe reference levels:
- PDH — Previous Day High (blue solid)
- PDL — Previous Day Low (red solid)
- PWH — Previous Week High (blue dashed)
- PWL — Previous Week Low (red dashed)
Lines start from the bar where the extreme was actually formed, not from the session open. They freeze when price takes the level, with an optional candle grace period. Labels show the level name and price.
Timezone: The indicator defaults to New York (ET). If your chart is set to a different timezone, adjust the Timezone setting to match so session detection stays accurate.
Informacje o Wersji
** Added Equal Highs and Lows detection** Added Key Swing Levels highest timeframe identification
Informacje o Wersji
** Added Session 50% Line.Skrypt open-source
W zgodzie z duchem TradingView twórca tego skryptu udostępnił go jako open-source, aby użytkownicy mogli przejrzeć i zweryfikować jego działanie. Ukłony dla autora. Korzystanie jest bezpłatne, jednak ponowna publikacja kodu podlega naszym Zasadom serwisu.

Wyłączenie odpowiedzialności
Informacje i publikacje nie stanowią i nie powinny być traktowane jako porady finansowe, inwestycyjne, tradingowe ani jakiekolwiek inne rekomendacje dostarczane lub zatwierdzone przez TradingView. Więcej informacji znajduje się w Warunkach użytkowania.
Skrypt open-source
W zgodzie z duchem TradingView twórca tego skryptu udostępnił go jako open-source, aby użytkownicy mogli przejrzeć i zweryfikować jego działanie. Ukłony dla autora. Korzystanie jest bezpłatne, jednak ponowna publikacja kodu podlega naszym Zasadom serwisu.
Wyłączenie odpowiedzialności
Informacje i publikacje nie stanowią i nie powinny być traktowane jako porady finansowe, inwestycyjne, tradingowe ani jakiekolwiek inne rekomendacje dostarczane lub zatwierdzone przez TradingView. Więcej informacji znajduje się w Warunkach użytkowania.