OPEN-SOURCE SCRIPT
Aura Sentiment & Risk Flow [Pineify]
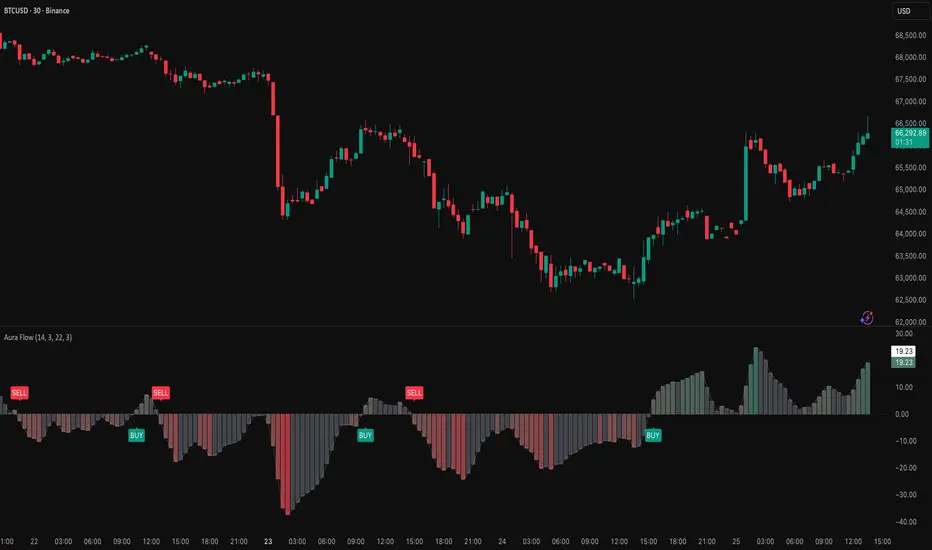
Aura Sentiment & Risk Flow - Advanced Market Sentiment & Volatility Analyzer
A powerful dual-panel oscillator combining market sentiment analysis with volatility-based risk assessment for enhanced trading decisions.
The Aura Sentiment & Risk Flow indicator represents an innovative approach to market analysis by merging two distinct but complementary technical concepts. This script is designed for traders who want to understand not just market direction, but also the underlying risk environment that accompanies price movements.
How It Works
The indicator operates on two parallel calculation paths that work together to provide comprehensive market analysis:
Trading Ideas and Insights
How Multiple Indicators Work Together
This script combines RSI and Chandelier Exit concepts in a synergistic manner:
Unique Aspects
How to Use
Customization Options
Conclusion
The Aura Sentiment & Risk Flow indicator offers traders a sophisticated yet intuitive tool for market analysis. By combining proven RSI momentum concepts with Chandelier Exit volatility measurements, it provides actionable insights into both market direction and risk conditions. Whether you are a day trader looking for quick entries or a swing trader seeking trend confirmation, this indicator adapts to your trading style through its customizable parameters.
A powerful dual-panel oscillator combining market sentiment analysis with volatility-based risk assessment for enhanced trading decisions.
The Aura Sentiment & Risk Flow indicator provides traders with a comprehensive view of market momentum and risk conditions by combining two proven technical concepts: RSI-based sentiment analysis and Chandelier Exit volatility measurements. This unique combination helps traders identify potential trend reversals, momentum shifts, and high-risk market conditions in real-time.
- Sentiment Aura Histogram with dynamic gradient coloring
- Chandelier Exit-based Risk Oscillator
- Real-time Buy/Sell signal generation
- Extreme risk zone detection
- Customizable color schemes and parameters
- Built-in TradingView alerts
The Aura Sentiment & Risk Flow indicator represents an innovative approach to market analysis by merging two distinct but complementary technical concepts. This script is designed for traders who want to understand not just market direction, but also the underlying risk environment that accompanies price movements.
How It Works
The indicator operates on two parallel calculation paths that work together to provide comprehensive market analysis:
- Sentiment Calculation (RSI-Based Momentum)
The script calculates market sentiment using a modified RSI (Relative Strength Index) approach:
- Raw RSI is computed using the standard 14-period setting (customizable)
- RSI values are normalized to a -50 to +50 scale for better visual centering around the zero line
- Additional smoothing is applied using Simple Moving Average to reduce noise and false signals
- Positive values indicate bullish sentiment; negative values indicate bearish sentiment - Risk Calculation (Chandelier Exit Logic)
Risk assessment is derived from the Chandelier Exit concept:
- ATR (Average True Range) measures current market volatility
- Highest High and Lowest Low over the lookback period define the trading range
- Chandelier Long and Short levels are calculated using ATR multiplier
- Risk oscillator normalizes current price position relative to these Chandelier levels
- This creates a dynamic risk measurement that expands and contracts with volatility
Trading Ideas and Insights
- Trend Confirmation: When sentiment histogram is consistently above zero and rising, it confirms bullish momentum. Conversely, sustained negative values confirm bearish trends.
- Momentum Divergence: Watch for situations where price makes new highs but sentiment histogram fails to confirm - this could signal weakening momentum and potential reversal.
- Risk Awareness: The background color change when sentiment reaches extreme levels (above 40 or below -40) serves as a warning that the market may be overbought or oversold, potentially leading to a correction.
- Signal Trading: The Buy (BUY) and Sell (SELL) labels appear when the sentiment oscillator crosses the zero line, providing clear entry and exit points.
How Multiple Indicators Work Together
This script combines RSI and Chandelier Exit concepts in a synergistic manner:
- RSI Component: Provides the foundation for sentiment analysis by measuring the magnitude and speed of price changes. The normalization to -50/+50 scale makes it intuitive for traders to identify bullish vs bearish territory.
- Chandelier Exit Component: Adds a risk dimension by incorporating volatility. The ATR-based calculation ensures that risk levels automatically adjust to current market conditions - expanding during volatile periods and contracting during calm markets.
- Visual Integration: The dynamic gradient coloring uses the sentiment values to create an "aura" effect, making it easy to visually assess market conditions at a glance. White fading indicates momentum weakening, while full colors show strong momentum.
Unique Aspects
- Dual-Panel Philosophy: Unlike simple momentum oscillators, this indicator provides both directional sentiment AND risk assessment in a single view.
- Dynamic Risk Awareness: The extreme zone detection automatically highlights when sentiment reaches potentially unsustainable levels, helping traders avoid buying at tops or selling at bottoms.
- Noise Filtering: The smoothing parameters help reduce whipsaw signals while maintaining responsiveness to genuine trend changes.
- Professional Visual Design: The gradient histogram and signal line create a professional, easy-to-read display suitable for any chart timeframe.
How to Use
- Timeframe Flexibility: Works on any timeframe from 1-minute to monthly charts. Higher timeframes generally produce more reliable signals.
- Best Practices:
- Use in conjunction with price action analysis
- Confirm signals with support/resistance levels
- Consider the overall market context (bull vs bear market)
- Combine with volume analysis for additional confirmation - Signal Interpretation:
- BUY signal: Sentiment crosses above zero = bullish momentum emerging
- SELL signal: Sentiment crosses below zero = bearish momentum emerging
- Extreme zones: Sentiment exceeds ±40 = potential reversal risk
Customization Options
- Sentiment Length (RSI Period): Default is 14. Lower values make the indicator more sensitive; higher values provide smoother, more reliable signals.
- Smoothing Factor: Default is 3. Controls the amount of smoothing applied to reduce noise.
- Risk Lookback (ATR Period): Default is 22. Defines the period for calculating highest high and lowest low.
- Risk Multiplier: Default is 3.0. Adjusts the Chandelier Exit sensitivity. Higher values create wider risk bands.
- Color Customization: Choose custom bullish, bearish, and neutral colors to match your trading platform theme.
Conclusion
The Aura Sentiment & Risk Flow indicator offers traders a sophisticated yet intuitive tool for market analysis. By combining proven RSI momentum concepts with Chandelier Exit volatility measurements, it provides actionable insights into both market direction and risk conditions. Whether you are a day trader looking for quick entries or a swing trader seeking trend confirmation, this indicator adapts to your trading style through its customizable parameters.
Remember: No indicator guarantees profits. Always use proper risk management and combine multiple analytical methods for best results.
Skrypt open-source
W zgodzie z duchem TradingView twórca tego skryptu udostępnił go jako open-source, aby użytkownicy mogli przejrzeć i zweryfikować jego działanie. Ukłony dla autora. Korzystanie jest bezpłatne, jednak ponowna publikacja kodu podlega naszym Zasadom serwisu.

🚀🚀🚀 Pineify - pineify.app
Essential Toolkit for Every Trader
- AI Pine Script Generator
- Finance AI Agent
- AI Stock Picker
- Pine Script Visual Editor
- Invited indicators
- Strategy Optimizer
- Trading Journal
- Backtest Report
Essential Toolkit for Every Trader
- AI Pine Script Generator
- Finance AI Agent
- AI Stock Picker
- Pine Script Visual Editor
- Invited indicators
- Strategy Optimizer
- Trading Journal
- Backtest Report
Wyłączenie odpowiedzialności
Informacje i publikacje nie stanowią i nie powinny być traktowane jako porady finansowe, inwestycyjne, tradingowe ani jakiekolwiek inne rekomendacje dostarczane lub zatwierdzone przez TradingView. Więcej informacji znajduje się w Warunkach użytkowania.
Skrypt open-source
W zgodzie z duchem TradingView twórca tego skryptu udostępnił go jako open-source, aby użytkownicy mogli przejrzeć i zweryfikować jego działanie. Ukłony dla autora. Korzystanie jest bezpłatne, jednak ponowna publikacja kodu podlega naszym Zasadom serwisu.
🚀🚀🚀 Pineify - pineify.app
Essential Toolkit for Every Trader
- AI Pine Script Generator
- Finance AI Agent
- AI Stock Picker
- Pine Script Visual Editor
- Invited indicators
- Strategy Optimizer
- Trading Journal
- Backtest Report
Essential Toolkit for Every Trader
- AI Pine Script Generator
- Finance AI Agent
- AI Stock Picker
- Pine Script Visual Editor
- Invited indicators
- Strategy Optimizer
- Trading Journal
- Backtest Report
Wyłączenie odpowiedzialności
Informacje i publikacje nie stanowią i nie powinny być traktowane jako porady finansowe, inwestycyjne, tradingowe ani jakiekolwiek inne rekomendacje dostarczane lub zatwierdzone przez TradingView. Więcej informacji znajduje się w Warunkach użytkowania.