OPEN-SOURCE SCRIPT
ORB Engine | ANONYCRYPTOUS
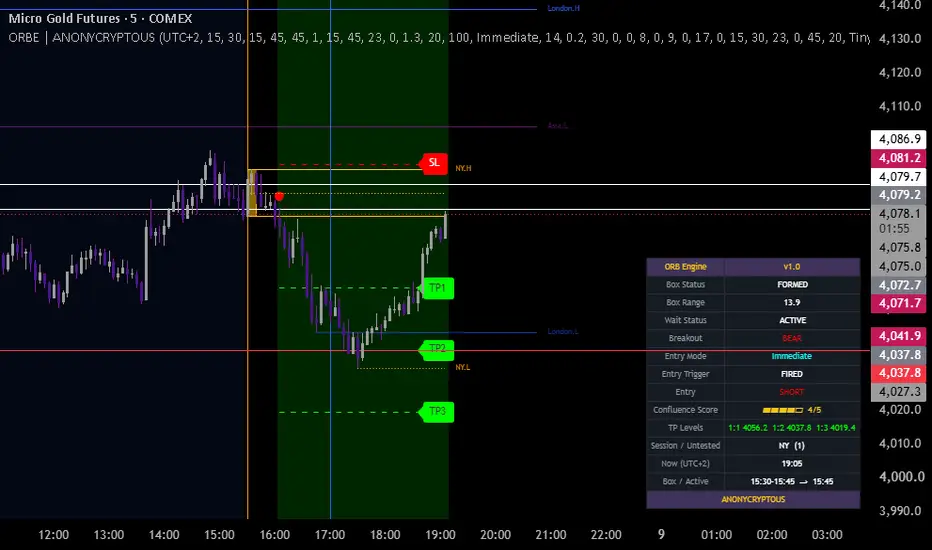
ORB Engine | Anonycryptous
Description & user manual
Why this indicator is different
The opening range is one of the most studied concepts in intraday trading, and for good reason. The first fifteen minutes after a major session opens concentrates the most institutional activity of the day. Breakouts from that range, followed by a retest of the level, are among the most statistically consistent setups available on lower timeframes.
The problem is execution. Most opening range tools stop at the box. They draw a high and low, and leave the trader to figure out the rest: when to trade, how to confirm direction, where the liquidity sits, how to time the entry. That gap between the concept and a usable trade is where most ORB approaches fall apart in practice.
The ORB Engine closes that gap. It does not just draw a box. It tracks the full sequence from formation through confirmation through entry, enforces a discipline around when trades are allowed, maps the session liquidity levels that the price is most likely to target or react from, and scores each setup against five confluence criteria before a signal fires. The result is a complete framework for opening range trading that works across instruments and timeframes.
Important notice
The ORB Engine generates visual states based on price structure, volume confirmation, session timing, and liquidity context. These states are not financial advice. They do not predict future price movement. They do not guarantee profitability. All trading decisions are made entirely by the user. Always manage your own risk. Always apply your own judgment.
1. Overview
The ORB Engine is an overlay indicator that combines opening range detection, breakout confirmation, three entry modes, session liquidity mapping, and a five-point confluence scoring system into a single framework. It is designed for intraday scalping and day trading on any instrument and any timeframe below one hour.
What it includes:
- Opening range box (configurable start and end times) with high, low, and midpoint lines
- Wait period enforcement that blocks entries until the active window opens
- Master toggle to disable the wait period entirely for pure ORB breakout use
- Volume-confirmed breakout detection, active as soon as the box closes
- Three entry modes: midpoint retest, breakout retest, and immediate
- Stop loss and take profit lines (1:1, 1:2, 1:3) drawn on entry
- Trade close detection: dashboard and background reset when stop or final target is hit
- Session liquidity engine with live (dotted) and locked (solid) levels for Asia, London, and NY sessions
- Previous session levels with automatic P. prefix labeling
- Vertical session boundary lines at each session open and close
- Five-point confluence score shown in the dashboard
- Status background coloring: red during wait period, green after entry fires
- Full timezone support: all time inputs in the user's chosen UTC offset
- Dashboard with all live trade and session context
- Nine alert conditions
2. Core concepts
2.1 The opening range box
The box captures the high and low of a configurable time window at the start of the active trading session. The default is the first fifteen minutes of the New York session (14:00-14:15 Amsterdam / 08:00-08:15 New York), which concentrates the most institutional activity of the intraday day. The box is drawn as soon as it closes, with a solid high line, a solid low line, and a dotted midpoint line that extends as the session progresses.
The box range is shown in the dashboard. A narrow box suggests tight price discovery. A wide box suggests early volatility and may require a wider stop if trading it directly.
2.2 The wait period
Breakouts in the first sixty to ninety minutes after a major open are frequently false. Institutional players test liquidity in both directions before committing. The wait period blocks entries from firing until a configurable time, defaulting to 15:30 Amsterdam / 09:30 New York, when the first significant volume wave of the day typically confirms direction.
Critically, breakout direction is still tracked during the wait period. If price breaks above the box high at 14:30 and the wait ends at 15:30, the system already knows the direction is bullish when the active window opens. The entry trigger then watches for the configured retest from that point, without waiting for a new breakout signal.
The wait period can be disabled entirely with the master toggle. With it off, the entry triggers are active immediately after the box closes, which is useful for strategies that do not rely on the NY open timing.
2.3 Entry modes
Three entry modes cover the main ways traders approach ORB setups.
Midpoint retest: the most conservative mode. After a confirmed breakout, the indicator waits for price to pull back to the box midpoint, close on the correct side of it, and then fires the entry signal. This mode is best when the session shows clear reversion behavior after the initial breakout impulse.
Breakout retest: waits for price to retest the box boundary itself (high for a bull breakout, low for a bear breakout) after the initial breakout bar, and fires on a candle that touches the level and closes on the breakout side. This mode suits trending sessions where price breaks cleanly, pulls back briefly to the level, and then continues.
Immediate: fires directly on the confirmed breakout candle. If the breakout happened during the wait period, the entry fires on the first bar of the active window. This is the most aggressive mode and is appropriate when the trader expects strong directional continuation without a pullback.
2.4 Breakout confirmation
A breakout is not registered on a close outside the box alone. The breakout candle's volume must exceed the average volume by a configurable multiplier (default 1.3x). This filters breakouts driven by thin participation, which are more likely to fail on the retest. The volume average and multiplier are both adjustable.
2.5 Stop loss and take profit
The stop loss is placed beyond the opposite side of the box, with a small ATR-based buffer. The buffer multiplier is configurable, allowing tighter or wider placement depending on the instrument and timeframe.
Take profit targets are calculated at 1:1, 1:2, and 1:3 risk-to-reward ratios from the entry level, each toggleable independently. All active levels are drawn as dashed lines from the entry bar and labeled on the chart. The dashboard shows the price levels for active targets.
When the stop is hit or the final active take profit is reached, the dashboard resets to a neutral state. The chart lines remain as a visual record.
2.6 Retest timeout
The retest modes have a configurable bar-count timeout. If price does not return to the required level within that number of bars after the active window opens (or after the breakout, if the wait period is off), the setup expires. The dashboard shows the expired state. The default is 100 bars, which on a 1-minute chart is 100 minutes and on a 5-minute chart is roughly eight hours, so adjust this per timeframe and strategy.
3. Session liquidity engine
3.1 Why session levels matter
Price does not move randomly between sessions. The high and low of the Asia, London, and NY sessions represent pools of resting orders: stops clustered above highs, stops clustered below lows. These are the levels institutional flow targets first. A breakout above the ORB box that is also pushing toward an untested session high is a very different proposition from a breakout into empty space.
The ORB Engine maps these levels automatically and keeps them visible across the session, so the confluence between the ORB setup and the nearest liquidity pool is always visible at a glance.
3.2 Live and locked levels
While a session is in progress, the indicator draws dotted lines for the developing high and low. These lines update in real time as new extremes are set within the window. If price sweeps through what was the high at 03:00 before London has closed, the dotted line moves up immediately, reflecting the new developing high. This prevents the missed sweep problem where a level was set early and then exceeded without the chart updating.
When a session closes, the dotted lines are replaced by solid locked lines. These represent the final confirmed high and low of that session.
3.3 Tested and untested levels
Once a session closes, its levels are tracked for mitigation. If price returns to a locked level and wicks through it, the level is marked as tested by fading to a configurable transparency. It does not disappear. Tested levels can act as re-entry points or warn that a previous pool has been cleared. The untested level count in the dashboard tells you how many unmitigated levels are still active on the chart.
3.4 Previous session levels
When a new session begins, the previous session's locked levels are relabeled with a P. prefix (e.g., P.Asia.H, P.NY.L) immediately at the start of the new session, not when it closes. This makes it immediately clear which levels are current and which are historical. The show previous day toggle controls whether one additional day of locked levels is retained alongside today's.
3.5 Vertical session lines
Vertical lines mark the open and close of each session window in the session's color. Style (solid or dotted) and width are configurable. The lines appear only for the current day and are cleaned up automatically at the next session start.
4. Confluence score
The dashboard shows a five-point confluence score for the current setup, displayed as a bar-style meter (▰▰▰▱▱) with the numeric value alongside. The five criteria are:
1. Box formed: the opening range has closed and the high, low, and midpoint are locked.
2. Volume confirmed: the breakout candle exceeded the volume threshold.
3. Liquidity bias consistent: the breakout direction aligns with the nearest untested session level in that direction (e.g., a bull breakout with an untested high above is a stronger setup than a bull breakout with no untested level overhead).
4. Retest within time: the entry fired before the timeout expired.
5. Risk-to-reward viable: the stop distance is within a configurable multiple of the box range, confirming the setup is not overextended.
A score of 3 or above indicates a setup where multiple factors are confirming each other. A score of 1 or 2 means fewer criteria are met and the setup carries more uncertainty. The score updates live.
5. Timezone and session configuration
All time inputs in the ORB Engine are entered in the user's own timezone. Set your UTC offset once in the Timezone group at the top of the settings, and then enter box start, box end, active window start, session end, and all session liquidity windows in your local clock time. The indicator converts everything to New York time internally.
The dashboard shows a live local clock (Now), the box and active window times in your timezone (Box / Active), and the current UTC offset in the row label so the conversion is always visible.
This design means users in Amsterdam, Dubai, Singapore, or New York all configure the same indicator the same way, in the time they think in, without manually calculating offsets.
6. Status background coloring
The chart background changes state with the setup:
- No background: before the box forms, or after the session ends.
- Red tint: the box has formed and the wait period is active. Entries are blocked.
- Green tint: an entry has fired and the trade is active.
The background colors, their transparency, and whether they are shown at all are individually configurable. The default transparency is high enough to not obscure the candles.
7. Dashboard reference
The dashboard updates on every bar and shows:
Box Status - forming, formed, or —.
Box Range - the distance between the box high and low in ticks.
Wait Status - waiting with remaining minutes, active, disabled, or —.
Breakout - bull, bear, or none.
Entry Mode - the currently selected entry mode.
Midpoint Retest / Breakout Retest / Entry Trigger - the retest status: waiting, fired, expired, or —.
Entry - long, short, or —.
Confluence Score - the five-point bar meter and numeric value.
TP Levels - price levels for each active take profit target, or — if no trade is open.
Session / Untested - the current session name and the count of untested liquidity levels.
Now (UTC offset) - the current local clock time in the configured timezone.
Box / Active - the box window and active window start times in local time.
8. Alerts
Nine alert conditions are available:
- Bull breakout: a volume-confirmed close above the box high.
- Bear breakout: a volume-confirmed close below the box low.
- Long entry signal: a long entry trigger has fired.
- Short entry signal: a short entry trigger has fired.
- Long stop loss hit: the long trade stop has been reached.
- Short stop loss hit: the short trade stop has been reached.
- Long final TP hit: the long trade reached the final active take profit.
- Short final TP hit: the short trade reached the final active take profit.
- Near untested liquidity level: price is within a configurable ATR distance of an untested session level.
9. How to use
9.1 Basic workflow
Set your timezone. Enter the box and session times in your local clock. The wait period defaults to the New York 09:30 open equivalent in your timezone, which is when the most reliable ORB confirmations historically occur.
Let the box form. The dashboard shows the forming state during the box window and transitions to formed when it closes. The box range gives you an immediate read on how much price discovery happened.
Observe the breakout. The system detects breakouts as soon as the box closes, even during the wait period. The dashboard shows the breakout direction and a dot appears on the breakout candle. With the wait period on, the background turns red and entries are blocked.
Wait for the active window. When the wait period ends, the background stays neutral and the entry trigger activates. Depending on the entry mode, it is now watching for a midpoint touch, a boundary retest, or it already fired immediately at the open of the active window.
Check the score. A confluence score of 3 or above with a clean entry signal in the context of a nearby untested session level is the strongest combination the system can produce.
9.2 Entry mode selection
Use midpoint retest on sessions that show clear pullback behavior after the initial breakout impulse. Use breakout retest on sessions that trend strongly but pause briefly at the broken level before continuing. Use immediate when price is moving fast and a retest is unlikely, or when you want to be positioned as early as possible in the active window.
9.3 Session levels as context
Before entering any signal, check which session levels are nearby. An entry directly into an untested opposite-side level is likely to stall or reverse at that level. An entry away from all untested levels, in the direction of the next unmitigated pool, is a cleaner setup. The dashboard untested count and the live chart lines give you this context without any additional tools.
9.4 Illustrative bull scenario
Educational example only. Not a trading recommendation.
The opening range forms between 14:00 and 14:15 with a 20-point range. At 14:35, a candle closes above the box high on 1.6 times average volume. The breakout is confirmed as bull, and the wait period background turns red. At 15:30 the active window opens. Price is still above the box high and the midpoint retest mode is active. At 15:42, price dips back to the midpoint, wicks it, and closes above. The entry fires long. Score is 4/5: box formed, volume confirmed, retest in time, and RR viable. The NY.L below is the nearest untested level, well below the stop, so it is not a concern. TP1 is hit 18 minutes later.
9.5 Illustrative bear scenario
Educational example only. Not a trading recommendation.
A narrow 12-point box forms and breaks below the low at 14:28 on heavy volume. The breakout retest mode is selected. The wait period holds entries. At 15:30, price is trading 30 points below the box low. The system begins watching for a pullback back to the box low. At 15:44, price rallies back to the box low, taps it, and closes below. Short entry fires. Score is 3/5. Stop is placed above the box high with ATR buffer. TP2 is reached before the session ends.
10. Settings reference
Timezone: UTC offset selector for all time inputs and the dashboard clock.
Opening range box: start hour, start minute, end hour, end minute (all in local timezone), box color, box fill transparency, max box history in days.
Wait period: enable toggle, active window start hour and minute, session end hour and minute.
Entry settings: breakout volume multiplier, volume average length, retest timeout in bars, ATR length, stop loss ATR buffer, TP 1:1/1:2/1:3 toggles, SL/TP line projection in bars.
Session liquidity: show toggles for Asia, London, and NY with individual start and end times, colors, tested level transparency, line extend bars, show previous day toggle, label text size, show session vertical lines toggle, vertical line style and width, proximity alert toggle and ATR distance.
Confluence score: maximum risk-to-reward sanity check multiplier.
Dashboard: show toggle, position, text size.
Visualization: wait period background show, color, and transparency; entry active background show, color, and transparency.
11. Known limitations
The ORB Engine is designed for sessions that produce a directional move after the opening range. It performs best when the market has a clear bias — a breakout in one direction that holds and then retests cleanly before continuing.
In choppy, sideways price action, the indicator will produce repeated stop loss hits. If the opening range is narrow and price oscillates around the box boundaries without committing to a direction, a breakout in one direction can be followed immediately by a breakout in the opposite direction. Because the system locks breakout direction on the first confirmed move, subsequent reversals are not re-evaluated as a new setup within the same session. The result in choppy conditions is typically one or two stop loss hits before the session ends without a valid directional move.
This is not a flaw in the indicator — it reflects the reality that opening range strategies depend on directional follow-through. On days where the market is consolidating at the session open, no ORB approach will perform well. The confluence score provides some protection: a score below 3 indicates fewer confirming factors and may warrant sitting on the sidelines. The session liquidity levels can also help — if there is no clear untested level in the breakout direction, the setup has no obvious target and the probability of follow-through is lower.
The volume confirmation filter reduces false breakouts in thin conditions, but it does not eliminate them on highly volatile instruments where even noise candles can exceed the volume threshold. On assets with very low liquidity, the breakout volume multiplier should be raised above the default 1.3 to filter more aggressively.
On very low timeframes such as 1-minute charts, the retest timeout in bars covers fewer minutes. A timeout of 100 bars on a 1-minute chart gives 100 minutes of window. Adjust the timeout per timeframe to reflect how long a valid retest can realistically take on the instrument you are trading.
12. Disclaimer
This indicator is provided for educational and informational purposes only. Nothing in this document or in the indicator output constitutes financial advice or any form of recommendation. Trading financial instruments involves substantial risk of loss. Past performance is not indicative of future results. You may lose all of your invested capital. Anonycryptous accepts no responsibility or liability for any losses incurred as a result of using this indicator.
Description & user manual
Why this indicator is different
The opening range is one of the most studied concepts in intraday trading, and for good reason. The first fifteen minutes after a major session opens concentrates the most institutional activity of the day. Breakouts from that range, followed by a retest of the level, are among the most statistically consistent setups available on lower timeframes.
The problem is execution. Most opening range tools stop at the box. They draw a high and low, and leave the trader to figure out the rest: when to trade, how to confirm direction, where the liquidity sits, how to time the entry. That gap between the concept and a usable trade is where most ORB approaches fall apart in practice.
The ORB Engine closes that gap. It does not just draw a box. It tracks the full sequence from formation through confirmation through entry, enforces a discipline around when trades are allowed, maps the session liquidity levels that the price is most likely to target or react from, and scores each setup against five confluence criteria before a signal fires. The result is a complete framework for opening range trading that works across instruments and timeframes.
Important notice
The ORB Engine generates visual states based on price structure, volume confirmation, session timing, and liquidity context. These states are not financial advice. They do not predict future price movement. They do not guarantee profitability. All trading decisions are made entirely by the user. Always manage your own risk. Always apply your own judgment.
1. Overview
The ORB Engine is an overlay indicator that combines opening range detection, breakout confirmation, three entry modes, session liquidity mapping, and a five-point confluence scoring system into a single framework. It is designed for intraday scalping and day trading on any instrument and any timeframe below one hour.
What it includes:
- Opening range box (configurable start and end times) with high, low, and midpoint lines
- Wait period enforcement that blocks entries until the active window opens
- Master toggle to disable the wait period entirely for pure ORB breakout use
- Volume-confirmed breakout detection, active as soon as the box closes
- Three entry modes: midpoint retest, breakout retest, and immediate
- Stop loss and take profit lines (1:1, 1:2, 1:3) drawn on entry
- Trade close detection: dashboard and background reset when stop or final target is hit
- Session liquidity engine with live (dotted) and locked (solid) levels for Asia, London, and NY sessions
- Previous session levels with automatic P. prefix labeling
- Vertical session boundary lines at each session open and close
- Five-point confluence score shown in the dashboard
- Status background coloring: red during wait period, green after entry fires
- Full timezone support: all time inputs in the user's chosen UTC offset
- Dashboard with all live trade and session context
- Nine alert conditions
2. Core concepts
2.1 The opening range box
The box captures the high and low of a configurable time window at the start of the active trading session. The default is the first fifteen minutes of the New York session (14:00-14:15 Amsterdam / 08:00-08:15 New York), which concentrates the most institutional activity of the intraday day. The box is drawn as soon as it closes, with a solid high line, a solid low line, and a dotted midpoint line that extends as the session progresses.
The box range is shown in the dashboard. A narrow box suggests tight price discovery. A wide box suggests early volatility and may require a wider stop if trading it directly.
2.2 The wait period
Breakouts in the first sixty to ninety minutes after a major open are frequently false. Institutional players test liquidity in both directions before committing. The wait period blocks entries from firing until a configurable time, defaulting to 15:30 Amsterdam / 09:30 New York, when the first significant volume wave of the day typically confirms direction.
Critically, breakout direction is still tracked during the wait period. If price breaks above the box high at 14:30 and the wait ends at 15:30, the system already knows the direction is bullish when the active window opens. The entry trigger then watches for the configured retest from that point, without waiting for a new breakout signal.
The wait period can be disabled entirely with the master toggle. With it off, the entry triggers are active immediately after the box closes, which is useful for strategies that do not rely on the NY open timing.
2.3 Entry modes
Three entry modes cover the main ways traders approach ORB setups.
Midpoint retest: the most conservative mode. After a confirmed breakout, the indicator waits for price to pull back to the box midpoint, close on the correct side of it, and then fires the entry signal. This mode is best when the session shows clear reversion behavior after the initial breakout impulse.
Breakout retest: waits for price to retest the box boundary itself (high for a bull breakout, low for a bear breakout) after the initial breakout bar, and fires on a candle that touches the level and closes on the breakout side. This mode suits trending sessions where price breaks cleanly, pulls back briefly to the level, and then continues.
Immediate: fires directly on the confirmed breakout candle. If the breakout happened during the wait period, the entry fires on the first bar of the active window. This is the most aggressive mode and is appropriate when the trader expects strong directional continuation without a pullback.
2.4 Breakout confirmation
A breakout is not registered on a close outside the box alone. The breakout candle's volume must exceed the average volume by a configurable multiplier (default 1.3x). This filters breakouts driven by thin participation, which are more likely to fail on the retest. The volume average and multiplier are both adjustable.
2.5 Stop loss and take profit
The stop loss is placed beyond the opposite side of the box, with a small ATR-based buffer. The buffer multiplier is configurable, allowing tighter or wider placement depending on the instrument and timeframe.
Take profit targets are calculated at 1:1, 1:2, and 1:3 risk-to-reward ratios from the entry level, each toggleable independently. All active levels are drawn as dashed lines from the entry bar and labeled on the chart. The dashboard shows the price levels for active targets.
When the stop is hit or the final active take profit is reached, the dashboard resets to a neutral state. The chart lines remain as a visual record.
2.6 Retest timeout
The retest modes have a configurable bar-count timeout. If price does not return to the required level within that number of bars after the active window opens (or after the breakout, if the wait period is off), the setup expires. The dashboard shows the expired state. The default is 100 bars, which on a 1-minute chart is 100 minutes and on a 5-minute chart is roughly eight hours, so adjust this per timeframe and strategy.
3. Session liquidity engine
3.1 Why session levels matter
Price does not move randomly between sessions. The high and low of the Asia, London, and NY sessions represent pools of resting orders: stops clustered above highs, stops clustered below lows. These are the levels institutional flow targets first. A breakout above the ORB box that is also pushing toward an untested session high is a very different proposition from a breakout into empty space.
The ORB Engine maps these levels automatically and keeps them visible across the session, so the confluence between the ORB setup and the nearest liquidity pool is always visible at a glance.
3.2 Live and locked levels
While a session is in progress, the indicator draws dotted lines for the developing high and low. These lines update in real time as new extremes are set within the window. If price sweeps through what was the high at 03:00 before London has closed, the dotted line moves up immediately, reflecting the new developing high. This prevents the missed sweep problem where a level was set early and then exceeded without the chart updating.
When a session closes, the dotted lines are replaced by solid locked lines. These represent the final confirmed high and low of that session.
3.3 Tested and untested levels
Once a session closes, its levels are tracked for mitigation. If price returns to a locked level and wicks through it, the level is marked as tested by fading to a configurable transparency. It does not disappear. Tested levels can act as re-entry points or warn that a previous pool has been cleared. The untested level count in the dashboard tells you how many unmitigated levels are still active on the chart.
3.4 Previous session levels
When a new session begins, the previous session's locked levels are relabeled with a P. prefix (e.g., P.Asia.H, P.NY.L) immediately at the start of the new session, not when it closes. This makes it immediately clear which levels are current and which are historical. The show previous day toggle controls whether one additional day of locked levels is retained alongside today's.
3.5 Vertical session lines
Vertical lines mark the open and close of each session window in the session's color. Style (solid or dotted) and width are configurable. The lines appear only for the current day and are cleaned up automatically at the next session start.
4. Confluence score
The dashboard shows a five-point confluence score for the current setup, displayed as a bar-style meter (▰▰▰▱▱) with the numeric value alongside. The five criteria are:
1. Box formed: the opening range has closed and the high, low, and midpoint are locked.
2. Volume confirmed: the breakout candle exceeded the volume threshold.
3. Liquidity bias consistent: the breakout direction aligns with the nearest untested session level in that direction (e.g., a bull breakout with an untested high above is a stronger setup than a bull breakout with no untested level overhead).
4. Retest within time: the entry fired before the timeout expired.
5. Risk-to-reward viable: the stop distance is within a configurable multiple of the box range, confirming the setup is not overextended.
A score of 3 or above indicates a setup where multiple factors are confirming each other. A score of 1 or 2 means fewer criteria are met and the setup carries more uncertainty. The score updates live.
5. Timezone and session configuration
All time inputs in the ORB Engine are entered in the user's own timezone. Set your UTC offset once in the Timezone group at the top of the settings, and then enter box start, box end, active window start, session end, and all session liquidity windows in your local clock time. The indicator converts everything to New York time internally.
The dashboard shows a live local clock (Now), the box and active window times in your timezone (Box / Active), and the current UTC offset in the row label so the conversion is always visible.
This design means users in Amsterdam, Dubai, Singapore, or New York all configure the same indicator the same way, in the time they think in, without manually calculating offsets.
6. Status background coloring
The chart background changes state with the setup:
- No background: before the box forms, or after the session ends.
- Red tint: the box has formed and the wait period is active. Entries are blocked.
- Green tint: an entry has fired and the trade is active.
The background colors, their transparency, and whether they are shown at all are individually configurable. The default transparency is high enough to not obscure the candles.
7. Dashboard reference
The dashboard updates on every bar and shows:
Box Status - forming, formed, or —.
Box Range - the distance between the box high and low in ticks.
Wait Status - waiting with remaining minutes, active, disabled, or —.
Breakout - bull, bear, or none.
Entry Mode - the currently selected entry mode.
Midpoint Retest / Breakout Retest / Entry Trigger - the retest status: waiting, fired, expired, or —.
Entry - long, short, or —.
Confluence Score - the five-point bar meter and numeric value.
TP Levels - price levels for each active take profit target, or — if no trade is open.
Session / Untested - the current session name and the count of untested liquidity levels.
Now (UTC offset) - the current local clock time in the configured timezone.
Box / Active - the box window and active window start times in local time.
8. Alerts
Nine alert conditions are available:
- Bull breakout: a volume-confirmed close above the box high.
- Bear breakout: a volume-confirmed close below the box low.
- Long entry signal: a long entry trigger has fired.
- Short entry signal: a short entry trigger has fired.
- Long stop loss hit: the long trade stop has been reached.
- Short stop loss hit: the short trade stop has been reached.
- Long final TP hit: the long trade reached the final active take profit.
- Short final TP hit: the short trade reached the final active take profit.
- Near untested liquidity level: price is within a configurable ATR distance of an untested session level.
9. How to use
9.1 Basic workflow
Set your timezone. Enter the box and session times in your local clock. The wait period defaults to the New York 09:30 open equivalent in your timezone, which is when the most reliable ORB confirmations historically occur.
Let the box form. The dashboard shows the forming state during the box window and transitions to formed when it closes. The box range gives you an immediate read on how much price discovery happened.
Observe the breakout. The system detects breakouts as soon as the box closes, even during the wait period. The dashboard shows the breakout direction and a dot appears on the breakout candle. With the wait period on, the background turns red and entries are blocked.
Wait for the active window. When the wait period ends, the background stays neutral and the entry trigger activates. Depending on the entry mode, it is now watching for a midpoint touch, a boundary retest, or it already fired immediately at the open of the active window.
Check the score. A confluence score of 3 or above with a clean entry signal in the context of a nearby untested session level is the strongest combination the system can produce.
9.2 Entry mode selection
Use midpoint retest on sessions that show clear pullback behavior after the initial breakout impulse. Use breakout retest on sessions that trend strongly but pause briefly at the broken level before continuing. Use immediate when price is moving fast and a retest is unlikely, or when you want to be positioned as early as possible in the active window.
9.3 Session levels as context
Before entering any signal, check which session levels are nearby. An entry directly into an untested opposite-side level is likely to stall or reverse at that level. An entry away from all untested levels, in the direction of the next unmitigated pool, is a cleaner setup. The dashboard untested count and the live chart lines give you this context without any additional tools.
9.4 Illustrative bull scenario
Educational example only. Not a trading recommendation.
The opening range forms between 14:00 and 14:15 with a 20-point range. At 14:35, a candle closes above the box high on 1.6 times average volume. The breakout is confirmed as bull, and the wait period background turns red. At 15:30 the active window opens. Price is still above the box high and the midpoint retest mode is active. At 15:42, price dips back to the midpoint, wicks it, and closes above. The entry fires long. Score is 4/5: box formed, volume confirmed, retest in time, and RR viable. The NY.L below is the nearest untested level, well below the stop, so it is not a concern. TP1 is hit 18 minutes later.
9.5 Illustrative bear scenario
Educational example only. Not a trading recommendation.
A narrow 12-point box forms and breaks below the low at 14:28 on heavy volume. The breakout retest mode is selected. The wait period holds entries. At 15:30, price is trading 30 points below the box low. The system begins watching for a pullback back to the box low. At 15:44, price rallies back to the box low, taps it, and closes below. Short entry fires. Score is 3/5. Stop is placed above the box high with ATR buffer. TP2 is reached before the session ends.
10. Settings reference
Timezone: UTC offset selector for all time inputs and the dashboard clock.
Opening range box: start hour, start minute, end hour, end minute (all in local timezone), box color, box fill transparency, max box history in days.
Wait period: enable toggle, active window start hour and minute, session end hour and minute.
Entry settings: breakout volume multiplier, volume average length, retest timeout in bars, ATR length, stop loss ATR buffer, TP 1:1/1:2/1:3 toggles, SL/TP line projection in bars.
Session liquidity: show toggles for Asia, London, and NY with individual start and end times, colors, tested level transparency, line extend bars, show previous day toggle, label text size, show session vertical lines toggle, vertical line style and width, proximity alert toggle and ATR distance.
Confluence score: maximum risk-to-reward sanity check multiplier.
Dashboard: show toggle, position, text size.
Visualization: wait period background show, color, and transparency; entry active background show, color, and transparency.
11. Known limitations
The ORB Engine is designed for sessions that produce a directional move after the opening range. It performs best when the market has a clear bias — a breakout in one direction that holds and then retests cleanly before continuing.
In choppy, sideways price action, the indicator will produce repeated stop loss hits. If the opening range is narrow and price oscillates around the box boundaries without committing to a direction, a breakout in one direction can be followed immediately by a breakout in the opposite direction. Because the system locks breakout direction on the first confirmed move, subsequent reversals are not re-evaluated as a new setup within the same session. The result in choppy conditions is typically one or two stop loss hits before the session ends without a valid directional move.
This is not a flaw in the indicator — it reflects the reality that opening range strategies depend on directional follow-through. On days where the market is consolidating at the session open, no ORB approach will perform well. The confluence score provides some protection: a score below 3 indicates fewer confirming factors and may warrant sitting on the sidelines. The session liquidity levels can also help — if there is no clear untested level in the breakout direction, the setup has no obvious target and the probability of follow-through is lower.
The volume confirmation filter reduces false breakouts in thin conditions, but it does not eliminate them on highly volatile instruments where even noise candles can exceed the volume threshold. On assets with very low liquidity, the breakout volume multiplier should be raised above the default 1.3 to filter more aggressively.
On very low timeframes such as 1-minute charts, the retest timeout in bars covers fewer minutes. A timeout of 100 bars on a 1-minute chart gives 100 minutes of window. Adjust the timeout per timeframe to reflect how long a valid retest can realistically take on the instrument you are trading.
12. Disclaimer
This indicator is provided for educational and informational purposes only. Nothing in this document or in the indicator output constitutes financial advice or any form of recommendation. Trading financial instruments involves substantial risk of loss. Past performance is not indicative of future results. You may lose all of your invested capital. Anonycryptous accepts no responsibility or liability for any losses incurred as a result of using this indicator.
Skrypt open-source
W zgodzie z duchem TradingView twórca tego skryptu udostępnił go jako open-source, aby użytkownicy mogli przejrzeć i zweryfikować jego działanie. Ukłony dla autora. Korzystanie jest bezpłatne, jednak ponowna publikacja kodu podlega naszym Zasadom serwisu.

Wyłączenie odpowiedzialności
Informacje i publikacje nie stanowią i nie powinny być traktowane jako porady finansowe, inwestycyjne, tradingowe ani jakiekolwiek inne rekomendacje dostarczane lub zatwierdzone przez TradingView. Więcej informacji znajduje się w Warunkach użytkowania.
Skrypt open-source
W zgodzie z duchem TradingView twórca tego skryptu udostępnił go jako open-source, aby użytkownicy mogli przejrzeć i zweryfikować jego działanie. Ukłony dla autora. Korzystanie jest bezpłatne, jednak ponowna publikacja kodu podlega naszym Zasadom serwisu.
Wyłączenie odpowiedzialności
Informacje i publikacje nie stanowią i nie powinny być traktowane jako porady finansowe, inwestycyjne, tradingowe ani jakiekolwiek inne rekomendacje dostarczane lub zatwierdzone przez TradingView. Więcej informacji znajduje się w Warunkach użytkowania.