Range Fan: Future Price Projection
█ Overview
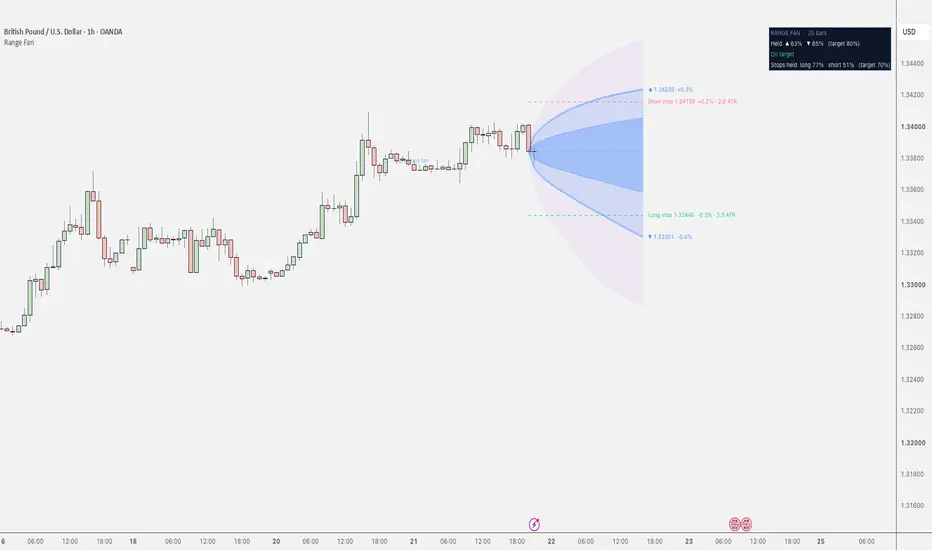
Range Fan draws a fan of expected price range ahead of the last closed bar. Its width comes from how far price actually travelled in comparable past windows on the same chart, scaled to current volatility (ATR). It answers one question: how far has price typically reached over the next N bars, up and down, from here?
It is a range, not a forecast. It has no directional bias, and the centre line is simply the last close. It also checks itself: a small panel compares the fan drawn at the start of each recent window with what price then really did.

▌ The fan
▌ Previous fan
A faint dotted outline of the wide band as it looked one horizon ago, labelled "previous fan". Compare it with the candles that followed to see how price really behaved inside it.
▌ Historical stop ruler
Two dashed lines, long (green) and short (red), at the distance price moved against a position in only (100 - Survival)% of past windows. With the default 70% survival, that distance was exceeded in about 30% of past windows. Labels show the price level, the percentage distance and the distance in ATR. It is a statistical noise distance, not a stop-loss recommendation.
▌ Fan Check chip
A small panel showing how often price stayed inside the wide band over recent history, upward and downward, against the target (80% by default). Status: "On target", "Bands running tight" or "Bands running wide".

█ How It Works
█ How to Use
█ Settings
Core Logic
Display
Historical Stop Ruler
Advanced
█ Alerts
Two alert conditions:
Each fires at bar close, on the first bar where the window that just ended reached farther in that direction than the wide band drawn when it began. It then stays quiet until the condition clears. These alerts report something that has already happened and are not forward signals. Set the alert to "Once Per Bar Close". They track the wide band only, not the core or extreme bands or the stop ruler.
█ Limitations
█ Disclaimer
This indicator is an analytical and educational tool, not financial advice or a guarantee of future results. Historical ranges do not predict future prices. You remain responsible for your own trading decisions.
Range Fan draws a fan of expected price range ahead of the last closed bar. Its width comes from how far price actually travelled in comparable past windows on the same chart, scaled to current volatility (ATR). It answers one question: how far has price typically reached over the next N bars, up and down, from here?
It is a range, not a forecast. It has no directional bias, and the centre line is simply the last close. It also checks itself: a small panel compares the fan drawn at the start of each recent window with what price then really did.
▌ The fan
- Core band (blue, strongest): price stayed inside this range in 50% of past windows.
- Wide band (blue, outlined with glow): 80% of past windows. This is the main band.
- Extreme band (purple, dotted): 95%. It marks rare, stretched moves.
- End labels: the wide-band price at the end of the horizon and its percentage distance from the last close.
- Dotted line: the start price the fan is anchored to.
▌ Previous fan
A faint dotted outline of the wide band as it looked one horizon ago, labelled "previous fan". Compare it with the candles that followed to see how price really behaved inside it.
▌ Historical stop ruler
Two dashed lines, long (green) and short (red), at the distance price moved against a position in only (100 - Survival)% of past windows. With the default 70% survival, that distance was exceeded in about 30% of past windows. Labels show the price level, the percentage distance and the distance in ATR. It is a statistical noise distance, not a stop-loss recommendation.
▌ Fan Check chip
A small panel showing how often price stayed inside the wide band over recent history, upward and downward, against the target (80% by default). Status: "On target", "Bands running tight" or "Bands running wide".
█ How It Works
- Windows. On every closed bar, the script measures how far price reached over the next k bars in earlier history: the highest high above the starting close (upside) and the lowest low below it (downside), each divided by the ATR at the start. A window is stored only after it has fully closed, so no future data is used.
- Three checkpoints. k = horizon / 3, 2 x horizon / 3 and the full horizon (20 bars by default: 7, 13 and 20).
- Quantiles. The latest 1000 stored windows (adjustable) are sorted, and the 50th, 80th and 95th percentiles of upside and downside reach are taken separately at each checkpoint. Widths are forced never to shrink over time.
- Shape. Between checkpoints the width grows linearly with the square root of time, which gives the curved fan.
- Scale. The fan is anchored on the last closed bar's close and scaled by that bar's ATR, so it widens in volatile conditions and narrows in quiet ones.
- Warm-up. Nothing is drawn until at least 60 completed windows exist.
- Fan Check. For each of the last 300 bars (adjustable), the wide band as it was drawn when that window began is compared with the reach that actually followed. "Held" is the share of windows inside the band. The status is "On target" within 8 percentage points of the target. At least 20 evaluations are needed before results show.
- Stop ruler. The distance is the chosen percentile of the downside reach (for longs) or upside reach (for shorts) at the full horizon, times ATR, measured from the last close or from your own entry price. The chip also shows how often those distances held in recent history.
█ How to Use
- Read the wide band as "where price has usually stayed over the next N bars". A move beyond it is rarer than usual in that market; the extreme band is rarer still.
- Compare the fan's width with your planned target and risk. If a target is far outside the wide band, price has rarely got there within this horizon.
- Check the Fan Check chip before trusting the bands. "Held" well below the target means the bands have been too tight lately; well above means too wide.
- Use the previous fan as a quick reality check on how price behaved inside the last fan.
- Pick a horizon that fits your style: 20 bars is roughly one trading day on 1-hour charts and one trading month on daily charts.
- The tool supplies analytical information only and makes no trading decisions for you.
- It works on crypto, forex and indices. Volatility and liquidity differ between them, so check the chip on each symbol and timeframe.
█ Settings
Core Logic
- Horizon (bars): 20 (6-100). How far ahead the fan reaches. Larger means a longer, wider fan.
- ATR length (scale): 14. Only scales past moves to current volatility. Higher is smoother and slower to react.
- History samples: 1000 (100-1000). How many completed windows the bands are built from. More is steadier but slower to adapt.
- Core band (%): 50. Wide band (%): 80. Extreme band (%): 95. The wide band is kept at least 5 points above the core, and the extreme at least 1 above the wide.
Display
- Extreme band, Previous fan, Edge glow, End labels, Fan Check chip: all on by default.
- Chip position: Top right. Text size: Small.
- Fan color: blue. Outer band color: purple.
Historical Stop Ruler
- Show historical stop ruler: on.
- Sides: Both.
- Survival (%): 70 (60-99). Higher puts the line further away and reached less often in the past, but risks more per trade.
- Entry price (0 = last close): 0. Optional. Distances are measured from this price.
- Long stop color / Short stop color: green and red.
Advanced
- Fan updates: Bar close. The fan is anchored on the last closed bar and does not move while a bar forms. "Every tick" anchors on the live price and the fan moves intrabar.
- Fan Check windows: 300 (50-500).
- Minimum samples: 60 (30-300).
█ Alerts
Two alert conditions:
- Range Fan: up-move beyond wide range
- Range Fan: down-move beyond wide range
Each fires at bar close, on the first bar where the window that just ended reached farther in that direction than the wide band drawn when it began. It then stays quiet until the condition clears. These alerts report something that has already happened and are not forward signals. Set the alert to "Once Per Bar Close". They track the wide band only, not the core or extreme bands or the stop ruler.
█ Limitations
- The fan is built from past data and assumes the future behaves roughly like the recent past. News, gaps and regime changes can break it.
- Windows overlap, so the samples are not independent. The effective sample size is smaller than the number shown, especially for the 95% band.
- The bands have no directional bias. They show how far, not which way.
- Each band is a reach envelope (highs and lows within the window), not a closing-price distribution.
- The Fan Check only evaluates recent bars and needs enough history. It checks the wide band, not the others.
- ATR scaling adapts slowly after sharp volatility changes.
- It is intended for standard candles. Heikin Ashi, Renko and similar chart types distort the data, and the chip warns when one is used.
- The fan is drawn only at the last bar and extends into empty chart space on the right.
- Intrabar behaviour: in "Bar close" mode the fan does not move while a bar forms. In "Every tick" mode it does.
- No backtests or profitability tests have been run. Use the Fan Check as your own live calibration.
█ Disclaimer
This indicator is an analytical and educational tool, not financial advice or a guarantee of future results. Historical ranges do not predict future prices. You remain responsible for your own trading decisions.

🔻🔻🔻🔻🔻🔻🔻🔻🔻🔻🔻🔻🔻🔻🔻🔻🔻🔻🔻
🧪 Free Simulators: minimalisttrading.com/tools/
📈 Trading Indicators: minimalisttrading.com
🔺🔺🔺🔺🔺🔺🔺🔺🔺🔺🔺🔺🔺🔺🔺🔺🔺🔺🔺
🧪 Free Simulators: minimalisttrading.com/tools/
📈 Trading Indicators: minimalisttrading.com
🔺🔺🔺🔺🔺🔺🔺🔺🔺🔺🔺🔺🔺🔺🔺🔺🔺🔺🔺
Wyłączenie odpowiedzialności
Informacje i publikacje nie stanowią i nie powinny być traktowane jako porady finansowe, inwestycyjne, tradingowe ani jakiekolwiek inne rekomendacje dostarczane lub zatwierdzone przez TradingView. Więcej informacji znajduje się w Warunkach użytkowania.
🔻🔻🔻🔻🔻🔻🔻🔻🔻🔻🔻🔻🔻🔻🔻🔻🔻🔻🔻
🧪 Free Simulators: minimalisttrading.com/tools/
📈 Trading Indicators: minimalisttrading.com
🔺🔺🔺🔺🔺🔺🔺🔺🔺🔺🔺🔺🔺🔺🔺🔺🔺🔺🔺
🧪 Free Simulators: minimalisttrading.com/tools/
📈 Trading Indicators: minimalisttrading.com
🔺🔺🔺🔺🔺🔺🔺🔺🔺🔺🔺🔺🔺🔺🔺🔺🔺🔺🔺
Wyłączenie odpowiedzialności
Informacje i publikacje nie stanowią i nie powinny być traktowane jako porady finansowe, inwestycyjne, tradingowe ani jakiekolwiek inne rekomendacje dostarczane lub zatwierdzone przez TradingView. Więcej informacji znajduje się w Warunkach użytkowania.