Ultimate Smart Money & Retail Suite [USR] V9
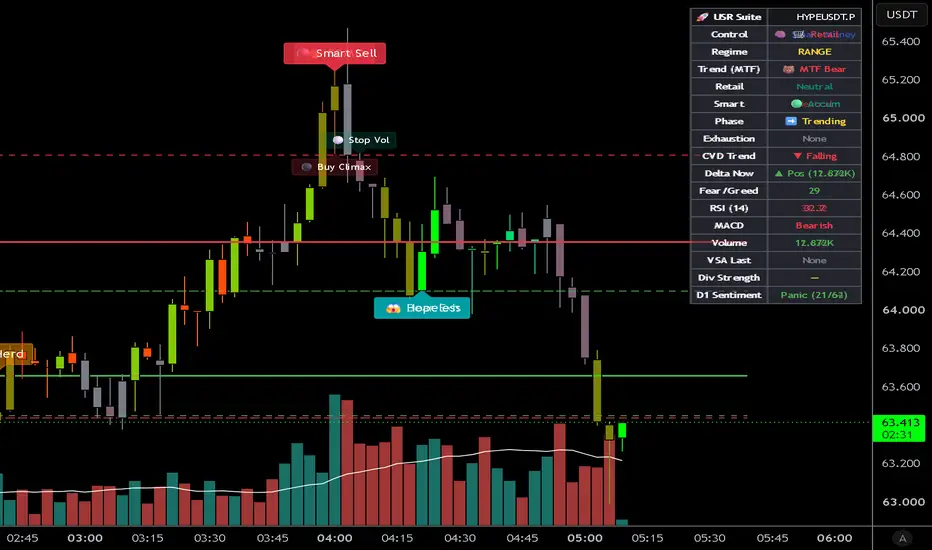
# 🚀 Ultimate Smart Money & Retail Suite V8 (USR Suite)
## 📌 Overview
The **Ultimate Smart Money & Retail Suite** is a comprehensive sentiment and volume analysis tool that combines multiple institutional-grade techniques into a single, unified oscillator. It helps traders identify:
- When **Smart Money** is accumulating or distributing.
- When **Retail traders** are trapped in FOMO or panic.
- **Volume Spread Analysis (VSA)** climaxes and stop-volumes.
- **Bullish/Bearish divergences** with strength scoring.
- **Exhaustion** and **regime shifts** (Trend, Range, Manipulation, Chop).
This is not a simple indicator—it's a complete trading suite designed for serious traders who want a 360° view of market psychology.
---
## 🧠 Core Components
### 1. Smart Money Proxy (🔵)
Combines three non-correlated metrics to estimate institutional activity:
- **MFI (Money Flow Index)** – measures buying/selling pressure with volume.
- **CMF (Chaikin Money Flow)** – captures accumulation/distribution over a longer period.
- **CVD Momentum** – detects acceleration in cumulative volume delta.
These three are normalized, smoothed with a Hull Moving Average, and displayed as the **blue line**.
---
### 2. Retail Sentiment Proxy (🔴)
Captures crowd behavior using:
- **RSI (14)** – identifies overbought/oversold extremes.
- **Percent Rank of Price (14)** – shows where price sits relative to recent range.
These are normalized, averaged, and smoothed to form the **red line**. When retail is >70, the crowd is chasing; when <30, they are panic-selling.
---
### 3. Volume Spread Analysis (VSA)
Detects high-volume anomalies with narrow/wide spreads:
- **⚪ Stop Volume** – high volume + red close + narrow spread → potential selling exhaustion (Smart Money absorbing).
- **⚫ Buying Climax** – ultra-high volume + green close + wide spread → potential distribution (Smart Money offloading).
---
### 4. Divergence Detection with Strength Scoring
Bullish and bearish divergences are identified using **confirmed pivots** (5-bar lookback). Each divergence is scored from ⭐ to ⭐⭐⭐⭐⭐ based on:
- CVD momentum alignment.
- VSA confirmation events.
- Retail depth (deeper panic / stronger FOMO).
- Smart Money strength at the pivot.
Divergences are plotted on the oscillator panel with **triangle markers** and labeled on the chart with **🔵 Smart Buy / 🔴 Smart Sell** (with dynamic cooldowns to avoid spam).
---
### 5. CVD & Delta Histogram
Displays real-time **bar delta** (buying vs selling volume) as columns on the oscillator panel:
- **Green columns** = net buying.
- **Red columns** = net selling.
- A 50-bar moving average normalizes the height for consistency.
---
### 6. Fear & Greed Index (Composite)
Combines RSI, ATR, volume direction, and Stochastic into a single 0–100 metric, displayed as an orange line on the oscillator.
---
### 7. Adaptive Zones
Overbought/oversold levels are **not fixed** at 80/20. Instead, they are calculated using **percentile ranks** (user-defined lookback), adapting to changing market volatility.
---
### 8. Real-Time Dashboard
A compact dashboard (top-right corner) displays:
- Market Control (Smart Money vs Retail).
- Current Regime (Trend / Range / Manip / Chop).
- MTF Trend (200/800 EMA alignment).
- Exhaustion status.
- CVD Trend & Current Delta.
- Fear & Greed Index.
- RSI & MACD state.
- Last VSA event.
- Divergence Strength (stars).
- Daily Timeframe Sentiment.
---
## 🔔 Signal Emojis & Cooldowns
All signals include **dynamic cooldowns** to prevent repeated alerts:
| Emoji | Signal | Description |
|-------|--------|-------------|
| 🔥 | FOMO | Breakout to new 50-bar high + RSI > 80 + 2x avg volume. |
| 🩸 | Panic | New 50-bar low + high volume + bull trend context. |
| 🐑 | Herd | 4+ green bars out of 5 + high volume + RSI > 70. |
| 🏃 | Chase | Smart Money distribution starting + Retail > 60. |
| 😴 | Bored | ADX < 14 + low volume (range-bound market). |
| 😱 | Hopeless | Smart Money accumulation + Retail < 40 + bull trend. |
| ⚡ Bull/Bear Exh | Exhaustion | Retail & Smart both at extremes + momentum reversal. |
| ⚪ Stop Vol | VSA Stop | High volume, red close, narrow spread. |
| ⚫ Buy Climax | VSA Climax | Ultra-high volume, green close, wide spread. |
---
## 📊 Trade Manager Overlay
When enabled, the indicator automatically plots **Stop-Loss and Take-Profit levels** on the price chart based on:
- **ATR (14)** – for volatility-adjusted stops.
- **Risk/Reward Ratio** – user-defined (default 2:1).
Levels appear after a bullish or bearish divergence is confirmed.
---
## ⚙️ Key Settings Overview
| Group | Key Inputs | Purpose |
|-------|------------|---------|
| **Core** | Normalization Lookback, Smoothing, Pivot Length | Controls sensitivity of the oscillator and divergence detection. |
| **VSA** | High/Ultra Volume Multipliers, Spread Multipliers | Fine-tunes Volume Spread Analysis sensitivity. |
| **Herd/Chase** | Green Bars, Volume Multiplier, RSI Threshold | Adjusts crowd behavior detection. |
| **Cooldowns** | Per-signal cooldown lengths | Prevents signal spam. |
| **Trade Manager** | ATR Multiplier, Risk/Reward Ratio | Controls SL/TP placement. |
All settings are fully configurable for different assets (crypto, stocks, forex).
---
## 🚨 Important Notes
1. **Divergences are confirmed** — they appear after the pivot is confirmed (no repainting once plotted). The built-in cooldowns also prevent re-triggering on the same pivot.
2. **Volume is required** — MFI and CMF fall back to RSI-based calculations only if volume is entirely absent (practically never in live markets).
3. **Best used on 15m – 4H timeframes** for intraday trading, but works on any timeframe.
4. **Performance** — the script is optimized with a 500-label limit and efficient calculations. Suitable for most chart setups.
---
## 📝 Recommended Workflow
1. **Identify the Regime** – Check the dashboard: is the market Trending, Ranging, or in Manipulation?
2. **Look for Divergences** – Bullish/Bearish divergences with 4–5 stars are high-probability setups.
3. **Confirm with VSA** – Stop Volume on a pullback increases confidence in bullish divergences. Buying Climax on a rally increases confidence in bearish divergences.
4. **Use the Trade Manager** – Let the indicator suggest SL/TP levels based on current volatility.
5. **Monitor the Dashboard** – Watch for shifts in Smart/Retail control and CVD direction.
---
## 📜 License
This source code is subject to the terms of the **Mozilla Public License 2.0** at mozilla.org/MPL/2.0/
Feel free to use it for personal analysis. If you find it helpful, a **like** and **follow** are greatly appreciated!
---
## 🙏 Credits
Built by **[darkaries88]** – combining years of market psychology, volume analysis, and Pine Script development into one unified tool.
*This indicator is for educational and analytical purposes only. Always conduct your own research and manage risk appropriately.*

Wyłączenie odpowiedzialności
Informacje i publikacje nie stanowią i nie powinny być traktowane jako porady finansowe, inwestycyjne, tradingowe ani jakiekolwiek inne rekomendacje dostarczane lub zatwierdzone przez TradingView. Więcej informacji znajduje się w Warunkach użytkowania.
Wyłączenie odpowiedzialności
Informacje i publikacje nie stanowią i nie powinny być traktowane jako porady finansowe, inwestycyjne, tradingowe ani jakiekolwiek inne rekomendacje dostarczane lub zatwierdzone przez TradingView. Więcej informacji znajduje się w Warunkach użytkowania.