ORB + FVG - FIB Dashboard & Multi-TF Confluences [Improved]
Advanced ORB + ICT PD-Array Confluence System [15m]
This institutional-grade breakout indicator is designed specifically for high-precision trading on indices like QQQ, SPY, and NQ. It combines the power of the 15-Minute Opening Range Breakout (ORB) with ICT PD Arrays (Fair Value Gaps & Order Blocks) and a sophisticated multi-factor confluence engine.
Unlike standard breakout indicators, this system requires price action to prove itself through institutional momentum (FVGs) and structural retests (Fibonacci Pullbacks) before issuing a signal.
🧠 Core Methodology
1. The 15-Minute Opening Range
The script automatically captures the high and low of the first 15 minutes of the New York session (09:30–09:45). These levels act as the "Battleground" for the rest of the day.
2. Institutional PD Arrays (FVG & OB)
The indicator identifies and tracks Fair Value Gaps (+/-FVG) and Order Blocks (+/-OB) using standard ICT logic.
Internal FVGs: Identifies institutional buildup inside the range before the snap.
External FVGs: Confirms institutional displacement beyond the range during the breakout.
Persistent Tracking: Boxes extend to the right automatically and are removed only when the gap is "filled" by price action.
3. Multi-Factor Confluence Dashboard
The real-time dashboard monitors 9 unique confluences to give you a "Strength Score" out of 9:
Volume & RSI: Momentum and relative strength confirmation.
MACD & EMA Cross: Trend alignment.
4H EMA: Higher Timeframe (HTF) trend filtering.
Fibonacci Pullback: Option to require a pullback to the .382, .500, or .618 levels before signal confirmation (preventing "chasing" the move).
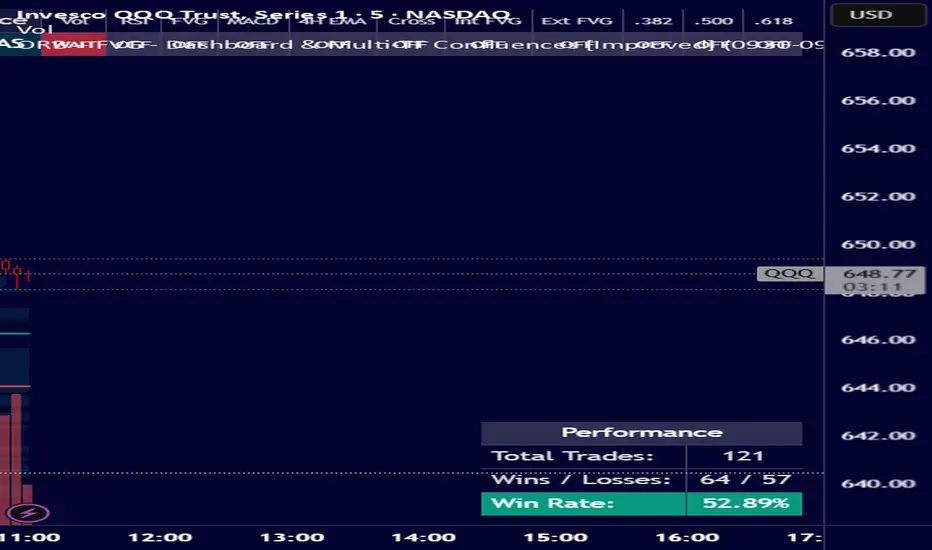
📊 Performance Dashboard
Stop guessing which confluences work best. The built-in Performance Dashboard tracks:
Total Trades: Every signal fired within your chosen date range.
Win/Loss Record: Based on a strict 1:1 Risk/Reward logic (opposite range side as SL).
Win Rate %: Updates in real-time as you toggle confluences on or off, allowing you to find the "Sweet Spot" for the current market regime.
🛠 How to Trade This System
Establish the Range: Wait for the 15-minute box to form at the NY Open.
Monitor the Bias: The dashboard will show Long or Short Bias based on price relation to the range midline.
Check Confluences: Look for a Strength Score of 7/9 or higher.
The Retest: If enabled, wait for the price to tap the chosen Fibonacci level after the breakout.
Entry: Execute on the BUY/SELL or FLIP labels.
Exit: The script prints a clear ORANGE EXIT label when the 9/20 EMA crosses in the opposite direction.
⚙️ Settings Highlights
Custom Sessions: Adjust the ORB window (e.g., 5-min or 30-min).
ICT Visuals: Lighter neon green FVGs and internal box labels (+FVG, -OB).
Date Range Backtest: Define a specific start/end date for the performance stats.
Fully Configurable: Toggle every filter on or off to suit your style.
Disclaimer: Trading involves significant risk. This tool is designed to assist with confluence and data visualization, not to provide financial advice. Always practice proper risk management.
This institutional-grade breakout indicator is designed specifically for high-precision trading on indices like QQQ, SPY, and NQ. It combines the power of the 15-Minute Opening Range Breakout (ORB) with ICT PD Arrays (Fair Value Gaps & Order Blocks) and a sophisticated multi-factor confluence engine.
Unlike standard breakout indicators, this system requires price action to prove itself through institutional momentum (FVGs) and structural retests (Fibonacci Pullbacks) before issuing a signal.
🧠 Core Methodology
1. The 15-Minute Opening Range
The script automatically captures the high and low of the first 15 minutes of the New York session (09:30–09:45). These levels act as the "Battleground" for the rest of the day.
2. Institutional PD Arrays (FVG & OB)
The indicator identifies and tracks Fair Value Gaps (+/-FVG) and Order Blocks (+/-OB) using standard ICT logic.
Internal FVGs: Identifies institutional buildup inside the range before the snap.
External FVGs: Confirms institutional displacement beyond the range during the breakout.
Persistent Tracking: Boxes extend to the right automatically and are removed only when the gap is "filled" by price action.
3. Multi-Factor Confluence Dashboard
The real-time dashboard monitors 9 unique confluences to give you a "Strength Score" out of 9:
Volume & RSI: Momentum and relative strength confirmation.
MACD & EMA Cross: Trend alignment.
4H EMA: Higher Timeframe (HTF) trend filtering.
Fibonacci Pullback: Option to require a pullback to the .382, .500, or .618 levels before signal confirmation (preventing "chasing" the move).
📊 Performance Dashboard
Stop guessing which confluences work best. The built-in Performance Dashboard tracks:
Total Trades: Every signal fired within your chosen date range.
Win/Loss Record: Based on a strict 1:1 Risk/Reward logic (opposite range side as SL).
Win Rate %: Updates in real-time as you toggle confluences on or off, allowing you to find the "Sweet Spot" for the current market regime.
🛠 How to Trade This System
Establish the Range: Wait for the 15-minute box to form at the NY Open.
Monitor the Bias: The dashboard will show Long or Short Bias based on price relation to the range midline.
Check Confluences: Look for a Strength Score of 7/9 or higher.
The Retest: If enabled, wait for the price to tap the chosen Fibonacci level after the breakout.
Entry: Execute on the BUY/SELL or FLIP labels.
Exit: The script prints a clear ORANGE EXIT label when the 9/20 EMA crosses in the opposite direction.
⚙️ Settings Highlights
Custom Sessions: Adjust the ORB window (e.g., 5-min or 30-min).
ICT Visuals: Lighter neon green FVGs and internal box labels (+FVG, -OB).
Date Range Backtest: Define a specific start/end date for the performance stats.
Fully Configurable: Toggle every filter on or off to suit your style.
Disclaimer: Trading involves significant risk. This tool is designed to assist with confluence and data visualization, not to provide financial advice. Always practice proper risk management.

Wyłączenie odpowiedzialności
Informacje i publikacje nie stanowią i nie powinny być traktowane jako porady finansowe, inwestycyjne, tradingowe ani jakiekolwiek inne rekomendacje dostarczane lub zatwierdzone przez TradingView. Więcej informacji znajduje się w Warunkach użytkowania.
Wyłączenie odpowiedzialności
Informacje i publikacje nie stanowią i nie powinny być traktowane jako porady finansowe, inwestycyjne, tradingowe ani jakiekolwiek inne rekomendacje dostarczane lub zatwierdzone przez TradingView. Więcej informacji znajduje się w Warunkach użytkowania.