OPEN-SOURCE SCRIPT
Zaktualizowano AG Pro Liquidity Heatmap [AGPro Series]
AG Pro Liquidity Heatmap [AGPro Series]
Overview / What it does
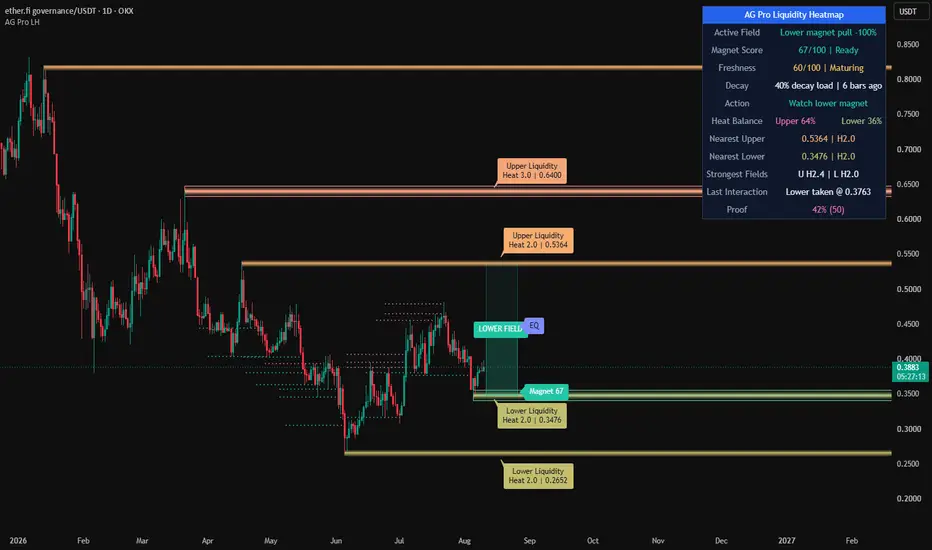
AG Pro Liquidity Heatmap is a visual liquidity-mapping tool designed to project areas where resting stop interest is more likely to be concentrated. Instead of focusing on a single pattern or a one-bar signal, this script builds a forward-looking heatmap from clustered pivot behavior and displays that information as persistent horizontal liquidity bands on the chart.
The core idea is simple: repeated reactions around similar price levels often create zones where traders place stops, breakout orders, or defensive exits. When those levels begin to cluster, they can become structurally important. This script converts that clustering behavior into a heat score and renders it as layered Fire / Ice bands so traders can quickly identify where liquidity concentration may be building above or below current price.
The script is not built as a prediction engine, and it does not attempt to claim where price must go next. Its purpose is to help traders organize the chart, monitor the nearest active liquidity bands, and understand which nearby levels appear more saturated, more persistent, or already mitigated. In that sense, it is best used as a market-structure context tool rather than as a standalone entry model.
This script is also intentionally different from traditional support/resistance overlays, breakout detectors, and liquidity sweep labels. It does not merely mark recent highs and lows. It clusters pivot-derived levels, weights them into a dynamic heat score, extends them cleanly to the right side of the chart, and then updates or extinguishes them as price interacts with those zones.

Unique Edge
The unique edge of this script is that it treats liquidity as a developing field rather than a static line. A normal horizontal level script may show one prior high or one prior low. AG Pro Liquidity Heatmap instead tracks repeated pivot concentration, merges nearby levels into composite zones, scores those zones, and then visualizes the result as a layered heat structure.
A second differentiator is the lifecycle logic. Once a band has been interacted with, the script does not leave every level unchanged forever. Depending on the selected behavior, a zone can fade or be removed after liquidity is taken. This helps reduce visual clutter and keeps the chart focused on currently relevant liquidity structures rather than a permanently accumulating archive of old levels.
A third differentiator is presentation. The script is designed to produce a clean forward projection area with right-extending heat bands, readable labels, Fire / Ice theme control, a functional heatmap panel, and an optional EQ Magnet line that tracks the balance area between the nearest active upper and lower liquidity bands. The goal is not only analytical clarity, but also a chart layout that remains readable during live use.
Methodology
1) Pivot detection
The script first identifies pivot highs and pivot lows using user-defined left and right pivot lengths. These pivots are treated as candidate liquidity reference points.
2) Cluster merging
If a new pivot forms close enough to an existing level, based on an ATR-driven merge distance, the script merges that information into the existing zone rather than creating unnecessary duplication. This allows nearby pivots to accumulate into a stronger composite band.
3) Heat scoring
Each zone receives a heat score. Repeated clustering increases that score. When volume weighting is enabled, pivots formed with relatively stronger volume can contribute more heavily to the final score. This does not reveal actual order book liquidity, but it can provide a useful proxy for where market attention and stop concentration may be stronger.
4) Layered rendering
Each active zone is rendered as a multi-layer horizontal band. The band thickness and saturation scale with heat score, which makes stronger zones visually heavier than weaker ones. This helps the chart communicate intensity without requiring the user to read every value manually.
5) Liquidity lifecycle
When price reaches a zone, the script can either fade it or remove it depending on the selected extinguish mode. Optional mitigation tracking can leave a visual reminder of where liquidity was taken. This behavior is important because it keeps the heatmap adaptive rather than static.
6) Balance tracking
When both upper and lower active liquidity bands are available, the script can display an EQ Magnet line between the nearest bands. This is not a target call. It is a contextual balance reference that can help visualize the midpoint of the currently nearest active liquidity field.
States & Visual Elements
- Fire bands represent upper liquidity concentration derived from pivot highs.
- Ice bands represent lower liquidity concentration derived from pivot lows.
- Stronger zones become visually denser and more prominent as heat score rises.
- Zone labels display side, heat score, and price information in either compact or detailed mode.
- The Heatmap Panel summarizes active band count, nearest zones, strongest zones, heat balance, last sweep information, and the current extinguish behavior.
- The EQ Magnet line highlights the midpoint between the nearest active upper and lower bands when enabled.
- Optional mitigation tracks can remain on the chart after liquidity is taken.
How to use it
This script is generally most useful as a context layer.
Many traders may choose to use it in one of three ways:
- to map where price may interact with nearby liquidity concentration,
- to judge whether the closest active field is above or below current price,
- to avoid taking impulsive decisions directly into dense opposing liquidity.
The script can also be useful for chart organization. Traders who already use trend tools, structure tools, or trigger models may use the heatmap as a location filter. For example, a setup forming directly into a strong opposing liquidity band may deserve more caution than a setup developing in cleaner space.
Key Inputs
Pivot Left / Right Bars
Controls how pivots are detected. Smaller values can produce more frequent zones; larger values can make the structure more selective.
Cluster Merge Distance (ATR)
Defines how close pivots must be to merge into the same liquidity band. Lower values keep zones more separated; higher values create broader clustering.
Volume-Weighted Mode
Allows higher-volume pivots to contribute more strongly to heat score. This is a proxy weighting mechanism, not direct order-flow confirmation.
Minimum Heat Score To Show
Filters out weaker zones from the visual display.
Visual Saturation Score
Controls how quickly the visual intensity reaches its maximum appearance.
Base Band Height and Horizontal Band Density
Shape the visual footprint of each zone and determine how rich or minimal the rendered band structure appears.
Label controls
Allow the user to choose label mode, font size, theme, label offsets, and label density.
Panel controls
Allow the user to change panel visibility, location, theme, and font size.
Liquidity Taken Behavior
Determines whether mitigated zones fade or are removed.

Limitations & Transparency
This script does not access order book data, exchange liquidation feeds, or hidden liquidity information. The displayed heatmap is derived from chart-based pivot clustering and optional volume weighting. For that reason, the bands should be understood as technical liquidity proxies rather than direct measurements of real resting orders.
The heat score is also relative to the script's own internal logic. It is a ranking mechanism inside this model, not an absolute market-wide score. A higher score means a zone has accumulated more structural weight within the selected settings; it does not guarantee a reaction.
Like any chart tool based on pivots, the behavior of the script depends on the chosen timeframe, the selected sensitivity inputs, and the structure of the instrument being analyzed. Lower timeframes can create more noise, while higher timeframes can produce fewer but broader zones.
The EQ Magnet line is a contextual midpoint reference only. It should not be interpreted as a fixed target, a required destination, or a directional forecast.
Risk Disclosure
This script is a visual analysis tool for chart study and trade planning. It is not financial advice, not an execution system, and not a promise of future price behavior. Liquidity zones can fail, be overrun, or be ignored by price entirely.
No indicator should be used in isolation. Traders should consider market structure, volatility, risk management, execution quality, and their own process before making trading decisions. Always test settings carefully and use position sizing appropriate to your own risk tolerance.
Overview / What it does
AG Pro Liquidity Heatmap is a visual liquidity-mapping tool designed to project areas where resting stop interest is more likely to be concentrated. Instead of focusing on a single pattern or a one-bar signal, this script builds a forward-looking heatmap from clustered pivot behavior and displays that information as persistent horizontal liquidity bands on the chart.
The core idea is simple: repeated reactions around similar price levels often create zones where traders place stops, breakout orders, or defensive exits. When those levels begin to cluster, they can become structurally important. This script converts that clustering behavior into a heat score and renders it as layered Fire / Ice bands so traders can quickly identify where liquidity concentration may be building above or below current price.
The script is not built as a prediction engine, and it does not attempt to claim where price must go next. Its purpose is to help traders organize the chart, monitor the nearest active liquidity bands, and understand which nearby levels appear more saturated, more persistent, or already mitigated. In that sense, it is best used as a market-structure context tool rather than as a standalone entry model.
This script is also intentionally different from traditional support/resistance overlays, breakout detectors, and liquidity sweep labels. It does not merely mark recent highs and lows. It clusters pivot-derived levels, weights them into a dynamic heat score, extends them cleanly to the right side of the chart, and then updates or extinguishes them as price interacts with those zones.
Unique Edge
The unique edge of this script is that it treats liquidity as a developing field rather than a static line. A normal horizontal level script may show one prior high or one prior low. AG Pro Liquidity Heatmap instead tracks repeated pivot concentration, merges nearby levels into composite zones, scores those zones, and then visualizes the result as a layered heat structure.
A second differentiator is the lifecycle logic. Once a band has been interacted with, the script does not leave every level unchanged forever. Depending on the selected behavior, a zone can fade or be removed after liquidity is taken. This helps reduce visual clutter and keeps the chart focused on currently relevant liquidity structures rather than a permanently accumulating archive of old levels.
A third differentiator is presentation. The script is designed to produce a clean forward projection area with right-extending heat bands, readable labels, Fire / Ice theme control, a functional heatmap panel, and an optional EQ Magnet line that tracks the balance area between the nearest active upper and lower liquidity bands. The goal is not only analytical clarity, but also a chart layout that remains readable during live use.
Methodology
1) Pivot detection
The script first identifies pivot highs and pivot lows using user-defined left and right pivot lengths. These pivots are treated as candidate liquidity reference points.
2) Cluster merging
If a new pivot forms close enough to an existing level, based on an ATR-driven merge distance, the script merges that information into the existing zone rather than creating unnecessary duplication. This allows nearby pivots to accumulate into a stronger composite band.
3) Heat scoring
Each zone receives a heat score. Repeated clustering increases that score. When volume weighting is enabled, pivots formed with relatively stronger volume can contribute more heavily to the final score. This does not reveal actual order book liquidity, but it can provide a useful proxy for where market attention and stop concentration may be stronger.
4) Layered rendering
Each active zone is rendered as a multi-layer horizontal band. The band thickness and saturation scale with heat score, which makes stronger zones visually heavier than weaker ones. This helps the chart communicate intensity without requiring the user to read every value manually.
5) Liquidity lifecycle
When price reaches a zone, the script can either fade it or remove it depending on the selected extinguish mode. Optional mitigation tracking can leave a visual reminder of where liquidity was taken. This behavior is important because it keeps the heatmap adaptive rather than static.
6) Balance tracking
When both upper and lower active liquidity bands are available, the script can display an EQ Magnet line between the nearest bands. This is not a target call. It is a contextual balance reference that can help visualize the midpoint of the currently nearest active liquidity field.
States & Visual Elements
- Fire bands represent upper liquidity concentration derived from pivot highs.
- Ice bands represent lower liquidity concentration derived from pivot lows.
- Stronger zones become visually denser and more prominent as heat score rises.
- Zone labels display side, heat score, and price information in either compact or detailed mode.
- The Heatmap Panel summarizes active band count, nearest zones, strongest zones, heat balance, last sweep information, and the current extinguish behavior.
- The EQ Magnet line highlights the midpoint between the nearest active upper and lower bands when enabled.
- Optional mitigation tracks can remain on the chart after liquidity is taken.
How to use it
This script is generally most useful as a context layer.
Many traders may choose to use it in one of three ways:
- to map where price may interact with nearby liquidity concentration,
- to judge whether the closest active field is above or below current price,
- to avoid taking impulsive decisions directly into dense opposing liquidity.
The script can also be useful for chart organization. Traders who already use trend tools, structure tools, or trigger models may use the heatmap as a location filter. For example, a setup forming directly into a strong opposing liquidity band may deserve more caution than a setup developing in cleaner space.
Key Inputs
Pivot Left / Right Bars
Controls how pivots are detected. Smaller values can produce more frequent zones; larger values can make the structure more selective.
Cluster Merge Distance (ATR)
Defines how close pivots must be to merge into the same liquidity band. Lower values keep zones more separated; higher values create broader clustering.
Volume-Weighted Mode
Allows higher-volume pivots to contribute more strongly to heat score. This is a proxy weighting mechanism, not direct order-flow confirmation.
Minimum Heat Score To Show
Filters out weaker zones from the visual display.
Visual Saturation Score
Controls how quickly the visual intensity reaches its maximum appearance.
Base Band Height and Horizontal Band Density
Shape the visual footprint of each zone and determine how rich or minimal the rendered band structure appears.
Label controls
Allow the user to choose label mode, font size, theme, label offsets, and label density.
Panel controls
Allow the user to change panel visibility, location, theme, and font size.
Liquidity Taken Behavior
Determines whether mitigated zones fade or are removed.
Limitations & Transparency
This script does not access order book data, exchange liquidation feeds, or hidden liquidity information. The displayed heatmap is derived from chart-based pivot clustering and optional volume weighting. For that reason, the bands should be understood as technical liquidity proxies rather than direct measurements of real resting orders.
The heat score is also relative to the script's own internal logic. It is a ranking mechanism inside this model, not an absolute market-wide score. A higher score means a zone has accumulated more structural weight within the selected settings; it does not guarantee a reaction.
Like any chart tool based on pivots, the behavior of the script depends on the chosen timeframe, the selected sensitivity inputs, and the structure of the instrument being analyzed. Lower timeframes can create more noise, while higher timeframes can produce fewer but broader zones.
The EQ Magnet line is a contextual midpoint reference only. It should not be interpreted as a fixed target, a required destination, or a directional forecast.
Risk Disclosure
This script is a visual analysis tool for chart study and trade planning. It is not financial advice, not an execution system, and not a promise of future price behavior. Liquidity zones can fail, be overrun, or be ignored by price entirely.
No indicator should be used in isolation. Traders should consider market structure, volatility, risk management, execution quality, and their own process before making trading decisions. Always test settings carefully and use position sizing appropriate to your own risk tolerance.
Informacje o Wersji
Update Notes - V1.4This update focuses on visual hierarchy, rendering stability, and chart readability while preserving the original objective of the script: mapping clustered liquidity areas in a clean, structured, and interpretation-friendly way. The core detection framework remains centered on heat-based liquidity concentration built from pivot clustering and optional volume weighting. The main work in this release was not to turn the indicator into a different tool, but to refine how liquidity information is organized, displayed, and maintained on the chart.
One of the most important changes in this version is improved runtime stability for long chart histories. Older heat zones are now handled more safely so historical objects do not trigger bar-index placement issues when the script is used on extended datasets. This helps maintain consistent rendering behavior across larger chart ranges and avoids visual breakdowns caused by objects anchored too far in the past.
The dashboard has also been rebuilt around a cleaner presentation standard. The first row now uses the unified single-row blue header format with only the script name displayed, which creates a more structured and professional panel layout. The internal panel hierarchy has been tightened so the key information is easier to read quickly: active heat bands, nearest liquidity, strongest liquidity, heat balance, last sweep context, and current lifecycle mode are all presented with clearer spacing and stronger visual separation.
The heatmap itself received a broader visual refinement pass. Liquidity bands are now more coherent in how they occupy space on the chart, with a better balance between presence and restraint. Stronger zones are emphasized more clearly, while weaker zones remain visible without making the chart look overloaded. This helps the map preserve a premium look while still allowing price structure to remain readable underneath the overlay.
The strongest upper and lower liquidity areas now stand out more effectively through upgraded emphasis logic. Rather than making the chart heavier, the visual treatment aims to create better priority recognition so the eye can identify the most relevant zones faster. This improves chart scanning without changing the underlying purpose of the script.
The EQ Magnet component was also refined. Its presentation now behaves more like a clean balance reference rather than an oversized visual block. The updated treatment is designed to communicate the equilibrium area between the nearest active upper and lower liquidity zones in a lighter and more controlled way. The goal here is visual clarity, not added complexity.
The heat balance section inside the panel has been upgraded as well. Relative buy-side and sell-side pressure can now be interpreted faster thanks to a more visible balance presentation. This does not convert the indicator into a predictive engine; it simply improves the readability of the current distribution of mapped liquidity strength.
Zone labels were kept selective to avoid clutter. This release continues the move toward showing meaningful labels without overwhelming the chart. The visible result is cleaner spacing, better separation between important zones, and a more refined overall screen presence. The script remains information-dense, but now communicates that information with more discipline.
Lifecycle handling for liquidity events also remains intact. Areas that are taken by price can still be faded or removed according to user settings, and mitigation tracking behavior is preserved. This keeps the script suitable for traders who prefer to monitor whether a liquidity zone remains active or has already been interacted with by price.
From a methodology perspective, the script still works as a liquidity-mapping and contextual visualization tool. It is not designed to predict future price with certainty, guarantee reversals, or function as an automated trading system. Heat zones represent areas of clustered historical interaction and relative emphasis inside the model, not fixed future outcomes. As always, chart context, market structure, volatility, and user judgment remain important.
In practical terms, this release is a quality and presentation upgrade. It improves stability, panel architecture, strongest-zone emphasis, heat balance readability, EQ visualization, and overall cleanliness on the chart while keeping the original concept intact. The result is a more polished Liquidity Heatmap that remains consistent with the existing methodology and more efficient to use during live chart analysis.
Transparency note:
This indicator is a visual analysis tool. It does not provide guaranteed outcomes, does not eliminate risk, and should not be treated as a stand-alone decision engine. Liquidity bands and heat values are model-based representations of chart behavior and should be interpreted together with price action and broader market context.
Risk disclosure:
This script is for chart analysis and educational use. It is not financial advice, not an execution system, and not a promise of performance. All trading and investment decisions involve risk.
Informacje o Wersji
Version 2.0 Update NotesThis update strengthens Liquidity Heatmap without changing its core identity. The script remains a pivot-cluster liquidity field map, focused on persistent upper and lower liquidity bands, heat-score concentration, and clean market-structure context.
What is new:
- Added a Liquidity Gravity Lane that projects the live field between the nearest active upper and lower liquidity bands.
- Added a Field Magnet level that weights nearby liquidity by both heat score and distance, giving the chart a clearer read on where the active field is pulling.
- Added freshness-weighted heat so newer active zones can receive slightly stronger visual priority while older clustered liquidity remains visible.
- Refined the default visual theme with the AGPro palette for a cleaner, more premium public-chart appearance.
- Improved dashboard structure with Field Bias, Heat Balance, nearest bands, strongest bands, lifecycle state, and latest interaction context.
- Updated label defaults for a more restrained chart: fewer labels per side by default, stronger offsets, and Normal font sizing for both labels and panel.
- Added capped mitigation tracks so previous liquidity interactions remain readable without overloading the chart.
- Cleaned public naming: the indicator title now follows the current AGPro standard by removing the leading AG Pro prefix while keeping [AGPro Series]. The panel header still uses AG Pro Liquidity Heatmap.
- Reworked public-facing labels and panel language around upper/lower liquidity fields rather than entry-style wording.
Why this update matters:
The previous version already mapped pivot-cluster liquidity bands. Version 2.0 makes the same concept more visually distinctive and easier to read in live charting. Instead of drifting into a liquidity grab detector, sweep quality tool, void mapper, or session-specific liquidity script, this update stays inside its own lane: a heatmap of developing liquidity concentration.
The new Gravity Lane and Field Magnet give the script a stronger visual signature while keeping the chart disciplined. Active bands still do the main work, but the forward projection area now helps traders understand the current liquidity field at a glance: nearest upper field, nearest lower field, balance point, pressure direction, and lifecycle state.
Informacje o Wersji
🔧 UPDATE NOTES - VERSION 2.1This update focuses on decision clarity, panel structure, field freshness, and liquidity-map readability.
The core purpose of the script remains unchanged.
Liquidity Heatmap continues to function as a pivot-cluster liquidity field map, built around active upper and lower liquidity bands, heat concentration, freshness, and lifecycle behavior.
This release does not turn the script into a sweep engine, void navigator, order block map, or entry signal tool.
It improves how the existing liquidity heatmap logic is organized, scored, and interpreted on the chart.
------------------------
What Changed
------------------------
• Added a 0-100 Magnet Score
The panel now converts active liquidity density, proximity, freshness, field pressure, and light trend context into a single 0-100 liquidity field score.
• Added clearer field readiness logic
The script now separates Building, Ready, Balanced, Upper Pressure, Lower Pressure, and inactive field states without using entry-style wording.
• Added Freshness and Decay readings
The panel now shows whether the active liquidity field is fresh, maturing, or decaying. This makes old liquidity fields easier to separate from newer active structures.
• Added a clearer next-action state
The Action row now gives neutral context such as Monitor Upper Field, Monitor Lower Field, Map Balanced Field, Build Evidence, Refresh Context, or Wait For Field.
• Tightened default visual filtering
The default heat threshold, visible zone count, band density, and label count were adjusted for a cleaner public-chart appearance while keeping the heatmap visually active.
• Added new alert conditions
Alerts now include liquidity field readiness, liquidity field state shift, and liquidity field decay warning, in addition to upper/lower liquidity interaction alerts.
------------------------
Visual Improvements
------------------------
• Reorganized the panel around the roadmap-required fields: Active Field, Magnet Score, Freshness, Decay, and Action.
• Preserved the single merged blue AGPro header row with only the script name.
• Kept the chart heatmap-native by preserving liquidity bands, gravity lane, field magnet, freshness heat, and decay behavior.
• Maintained restrained label density and offset logic so labels remain readable without hiding inside candles.
------------------------
Interface & Usability
------------------------
• Added Minimum Magnet Score as a configurable readiness threshold.
• Added Trend Context Length as a light scoring input, not a separate trend signal.
• Added Decay Warning Freshness to control when stale-field alerts trigger.
• Preserved panel visibility, panel location, panel theme, panel font size, and label font size controls.
------------------------
Behavior Notes
------------------------
This update does not change the core liquidity-clustering identity of the script.
The score is a relative field-readiness model inside this script, not a forecast and not a guarantee.
The update keeps Liquidity Heatmap separate from AGPro liquidity sweep, grab, void, and SMC footprint tools by staying focused on heatmap-native field pressure, freshness, and magnetization.
------------------------
Limitations Reminder
------------------------
The script remains a rule-based analytical visualization tool.
Liquidity bands are derived from chart-based pivot clustering and optional volume weighting. They do not represent direct order book data, liquidation feeds, or hidden institutional orders.
Market conditions such as volatility, liquidity, timeframe selection, and instrument behavior can affect how heat fields appear and decay.
------------------------
Risk Reminder
------------------------
This script is for educational and analytical chart study only.
It does not provide financial advice, automated execution, or guaranteed trading outcomes.
Users remain responsible for their own decisions, risk management, and interpretation of market context.
Informacje o Wersji
🔧 UPDATE NOTES - v2.2This update focuses on adding a magnet-pull proof and unifying label contrast.
The core purpose of the script remains unchanged.
This release adds a follow-through proof to the dashboard, makes the solid-theme
zone and field labels contrast-safe, and hardens the ATR baseline. It does not
change the liquidity clustering, heat scoring, or magnet logic.
This script continues to function as an analytical and visualization tool.
It does not attempt to predict price direction or provide guaranteed outcomes.
------------------------
What Changed
------------------------
• Proof row added to the dashboard
When the liquidity field is Ready and clearly biased toward one side, the script
now measures whether price followed through toward that dominant side (1.5 ATR)
before reversing against it (1.0 ATR), evaluated on confirmed closes. It reports
the follow-through share with the sample count, e.g. "53% (40)", and reads
"Building (n)" until at least 6 samples exist. This is a descriptive read of the
magnet thesis, not a forecast or win rate.
• Unified label contrast
On the default Premium Solid label theme, the zone badges and the EQ and Magnet
field labels now derive their text color from each fill brightness, so labels on
bright upper-side and dark lower-side fills both stay legible. The Glass and Neon
Dark label themes are unchanged.
• Hardened ATR baseline
The ATR used for merge distance, band height, label offsets, and field projection
now falls back to true range and a minimum tick on early or illiquid bars.
------------------------
Visual Improvements
------------------------
• Improved zone-label and field-label readability on the Premium Solid theme
• Kept liquidity bands, halos, spines, gravity lane, and magnet lines unchanged
• Maintained the premium heatmap density and label limits per side
------------------------
Interface & Usability
------------------------
• Dashboard now ends with a Proof row beneath Last Interaction
• The Proof row turns the magnet thesis into a single historical readout
• Enhanced overall user experience without changing the core detection
------------------------
Behavior Notes
------------------------
This update does not change the liquidity clustering, heat scoring, magnet score,
freshness, or decay logic.
The Proof row is a historical, descriptive follow-through statistic measured on a
fixed symmetric ATR reference at confirmed closes, opened only while the field is
Ready and biased. It is not a forecast, win rate, or trade instruction, and it is
symbol- and timeframe-dependent.
Users should interpret outputs the same way as before, now with an added
follow-through context read.
------------------------
Limitations Reminder
------------------------
The script remains a rule-based analytical tool.
Market conditions such as volatility, liquidity, and timeframe differences may
affect how fields form, resolve, and how the proof rate reads.
Outputs should always be interpreted within broader market context.
------------------------
Risk Reminder
------------------------
This script is for educational and analytical purposes only.
It does not provide financial advice or guaranteed trading outcomes.
Users remain responsible for their own decisions.
Informacje o Wersji
Version 2.3 – Projection Field ClarityThis release preserves the pivot-cluster heatmap, magnet scoring, liquidity lifecycle, and proof model while refining the forward field’s visual ownership and label separation.
• Added a centered, filled state badge inside the Liquidity Gravity Lane so the projected field is immediately identifiable as Upper, Lower, or Balanced.
• Separated EQ and Magnet badges into collision-aware vertical lanes and moved them beyond the projection endpoint to reduce overlap with nearby liquidity-zone labels.
• Positioned the Magnet badge toward the inside of the active field, away from the dominant upper or lower zone-label lane.
• Strengthened the optional Glass label theme with a contrast-safe filled AGPro backing while preserving its softer visual character.
Skrypt open-source
W zgodzie z duchem TradingView twórca tego skryptu udostępnił go jako open-source, aby użytkownicy mogli przejrzeć i zweryfikować jego działanie. Ukłony dla autora. Korzystanie jest bezpłatne, jednak ponowna publikacja kodu podlega naszym Zasadom serwisu.

Trading Suite | Flagship Workflow :
tradingview.com/script/XJmX3p98-Trading-Suite-AGPro-Series/
Crypto Setup Planner | Multi-Symbol Analysis :
tradingview.com/script/LgVRo7Ql-Crypto-Setup-Planner-AGPro-Series/
tradingview.com/script/XJmX3p98-Trading-Suite-AGPro-Series/
Crypto Setup Planner | Multi-Symbol Analysis :
tradingview.com/script/LgVRo7Ql-Crypto-Setup-Planner-AGPro-Series/
Wyłączenie odpowiedzialności
Informacje i publikacje nie stanowią i nie powinny być traktowane jako porady finansowe, inwestycyjne, tradingowe ani jakiekolwiek inne rekomendacje dostarczane lub zatwierdzone przez TradingView. Więcej informacji znajduje się w Warunkach użytkowania.
Skrypt open-source
W zgodzie z duchem TradingView twórca tego skryptu udostępnił go jako open-source, aby użytkownicy mogli przejrzeć i zweryfikować jego działanie. Ukłony dla autora. Korzystanie jest bezpłatne, jednak ponowna publikacja kodu podlega naszym Zasadom serwisu.
Trading Suite | Flagship Workflow :
tradingview.com/script/XJmX3p98-Trading-Suite-AGPro-Series/
Crypto Setup Planner | Multi-Symbol Analysis :
tradingview.com/script/LgVRo7Ql-Crypto-Setup-Planner-AGPro-Series/
tradingview.com/script/XJmX3p98-Trading-Suite-AGPro-Series/
Crypto Setup Planner | Multi-Symbol Analysis :
tradingview.com/script/LgVRo7Ql-Crypto-Setup-Planner-AGPro-Series/
Wyłączenie odpowiedzialności
Informacje i publikacje nie stanowią i nie powinny być traktowane jako porady finansowe, inwestycyjne, tradingowe ani jakiekolwiek inne rekomendacje dostarczane lub zatwierdzone przez TradingView. Więcej informacji znajduje się w Warunkach użytkowania.