OPEN-SOURCE SCRIPT
RSI Trade Entries
RSI TRADE ENTRIES
tradingview.com/u/Forex_Market_Insights/
OVERVIEW
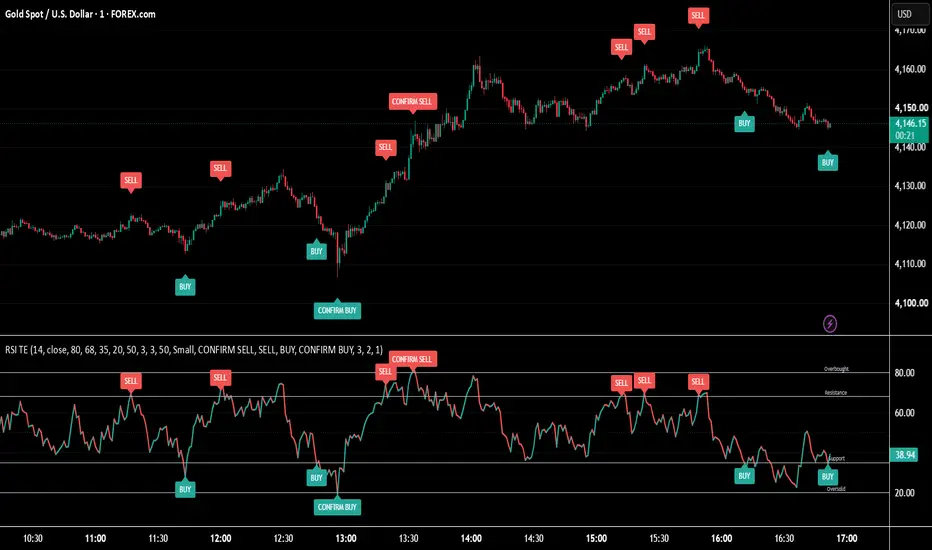
RSI Trade Entries turns the Relative Strength Index into a direct, readable entry-signal tool by dividing the oscillator into four decision levels instead of the usual two, and by printing every signal in two places at once: in the RSI pane where the level was touched, and on the candlestick chart at the same bar.
The four levels are not four copies of the same idea. They are two pairs with different jobs.
Overbought, default 80, prints CONFIRM SELL. This is a momentum extreme.
Resistance, default 68, prints SELL. This is the first meaningful overbought reaction.
Support, default 35, prints BUY. This is the first meaningful oversold reaction.
Oversold, default 20, prints CONFIRM BUY. This is a downside momentum extreme.
The inner pair are reached often and mark early reactions. The outer pair are reached rarely and mark genuine exhaustion. Reading them together lets you separate a routine pullback from a real momentum extreme without interpreting anything by eye.
The RSI line itself is coloured by its own slope, green while momentum is rising and red while it is falling, so the direction of the oscillator is readable instantly without tracing the line across the pane.
━━━━━━━━━━━━━━━━━━━━━━━━━━━━━━━━━━━━━━━━━━━━━━━━━━━━━━━━━━━━━━━━━━━━━━━━━━
WHY THIS INDICATOR WAS CREATED
Four specific problems drove this build.
1. Two levels are not enough information.
The standard 70 and 30 configuration answers only one question: is the market stretched or not. It cannot tell you whether momentum has merely reacted or has genuinely exhausted itself, because both situations look identical. Splitting the oscillator into an early-reaction pair and a confirmation pair answers that question directly, and it does so with the same numbers every time rather than through subjective reading.
2. The oscillator is in the wrong place.
RSI lives in a separate pane, below price. Every time it does something meaningful the trader has to look away from the candles, interpret the oscillator, and then look back and find the bar it happened on. That constant switching is where mistakes and missed entries come from. This tool prints the signal on the price chart itself, at the exact candle, so the oscillator's message arrives where the decision is actually being made.
3. Level tools produce far too many signals.
A naive level check fires on every bar the oscillator spends beyond a line. On a one-minute chart that buries the workspace in duplicate labels and makes alerts completely unusable. What was needed was a state model where one momentum swing produces one signal, not one signal per bar and not one per re-touch of the same line during the same push.
4. Most oscillator tools are not built for live use.
Many wait for the bar to close before showing anything, which means the signal arrives after the move it was meant to catch has already started. This tool evaluates levels on the forming bar so the signal appears the moment the level is reached, with the real-time behaviour documented openly rather than hidden.
━━━━━━━━━━━━━━━━━━━━━━━━━━━━━━━━━━━━━━━━━━━━━━━━━━━━━━━━━━━━━━━━━━━━━━━━━━
HOW IT WORKS, FULL METHODOLOGY
1. THE FOUR-LEVEL ARCHITECTURE
The oscillator is divided into four decision levels, all fully adjustable, along with RSI length and RSI source.
When RSI crosses up through the Overbought level, the tool prints CONFIRM SELL. Momentum has pushed to an extreme where continuation becomes statistically harder to sustain.
When RSI crosses up through the Resistance level, the tool prints SELL. This is the earlier, more frequent reaction level, reached long before true exhaustion.
When RSI crosses down through the Support level, the tool prints BUY. This is the mirror of Resistance on the downside.
When RSI crosses down through the Oversold level, the tool prints CONFIRM BUY. Downside momentum has reached an extreme.
Because each level carries its own independent state, a single strong push can legitimately produce a SELL at Resistance on the way up and then a CONFIRM SELL at Overbought if the push continues. Those are two different pieces of information about the same move, not a duplicate signal.
2. THE ANTI-REPEAT STATE MACHINE
This is the component that controls signal frequency, and it is the difference between a usable tool and a cluttered one.
Each of the four levels carries an armed or disarmed state. A level fires once when it is crossed, then immediately disarms itself. How it re-arms is what you control.
Midline reset, the default and recommended mode.
A level that has fired stays completely silent until RSI travels back across the midline, default 50. An overbought or resistance signal therefore cannot repeat until momentum has genuinely rotated back down through neutral, and a support or oversold signal cannot repeat until momentum has rotated back up. The practical result is roughly one signal per momentum swing rather than one per level touch. This is what keeps fast intraday charts readable.
Buffer reset.
With midline reset turned off, a level re-arms as soon as RSI pulls back past it by the configured buffer in RSI points. This produces considerably more signals and suits traders who want to see every level reaction rather than only swing-level ones.
On top of both modes, a per-level minimum bar gap acts as a final guard against clustering, blocking the same level from firing twice within a set number of bars.
3. THE DUAL-PANE LABEL SYSTEM
Every signal is drawn twice, from the same trigger, on the same bar.
In the RSI pane, the label is placed at the exact oscillator value where the level was touched, above the line for sell signals and below it for buy signals.
On the candlestick chart, the identical label is placed at the same bar, above the candle for sell signals and below it for buy signals. This is achieved from a single script using forced overlay placement, so you install one indicator, not two, and the two panes can never fall out of sync.
Price-chart labels are anchored using automatic above-bar and below-bar positioning rather than calculated price offsets. That means they sit correctly on an instrument priced at 0.65 and on one priced at 95,000, with no configuration.
Label text is fully editable, so you can replace CONFIRM SELL, SELL, BUY and CONFIRM BUY with your own wording if you prefer.
4. DYNAMIC LINE COLOURING
The RSI line is plotted with per-segment colour driven by its own slope. Rising momentum is drawn in the bullish colour, falling momentum in the bearish colour. Turning points are therefore visible as colour changes rather than as shape changes you have to trace.
Because a raw one-bar slope can flicker on tiny wiggles, an optional colour smoothing mode applies a short EMA to the slope before deciding the colour. Turn it on if you prefer clean colour blocks, leave it off if you want maximum responsiveness.
5. LEVEL VISUALISATION
All four levels are drawn as solid reference lines in the pane with adjustable colour and thickness, each labelled by name on the right so you always know which line is which. A faint dotted midline shows where the reset threshold sits, so you can see at a glance whether a level has re-armed yet.
━━━━━━━━━━━━━━━━━━━━━━━━━━━━━━━━━━━━━━━━━━━━━━━━━━━━━━━━━━━━━━━━━━━━━━━━━━
HOW TO READ IT ON THE CHART
- Green RSI segment means momentum is rising. Red means it is falling.
- SELL means RSI has reached the resistance level. The first overbought reaction of this swing.
- CONFIRM SELL means RSI has pushed all the way to the overbought extreme. A stronger reading than SELL.
- BUY means RSI has reached the support level. The first oversold reaction of this swing.
- CONFIRM BUY means RSI has reached the oversold extreme. A stronger reading than BUY.
- The same label always appears on both the price chart and the oscillator pane at the same candle.
- The dotted midline is the reset threshold. Until RSI crosses it, fired levels stay silent.
━━━━━━━━━━━━━━━━━━━━━━━━━━━━━━━━━━━━━━━━━━━━━━━━━━━━━━━━━━━━━━━━━━━━━━━━━━
PRACTICAL USE
Reading the two tiers.
Treat SELL and BUY as attention signals and CONFIRM SELL and CONFIRM BUY as conviction signals. A SELL that never becomes a CONFIRM SELL usually marks a shallow pullback inside a trend. A SELL followed by a CONFIRM SELL on the same push describes a market that has driven momentum to an extreme, which is where reactions tend to be larger.
Trading with trend context.
Oscillator levels are strongest when they agree with structure. In an established uptrend, the BUY and CONFIRM BUY signals mark pullback entries in the direction of the trend, while SELL signals mostly mark exits or partial profit-taking rather than reversals. In a downtrend the roles invert. The tool deliberately does not impose a trend filter on you, because that judgement belongs with the trader and the surrounding chart.
Ranging markets.
In a genuine range, all four levels behave closest to their textbook meaning, and CONFIRM signals at the range extremes are the highest-quality readings the tool produces.
Controlling frequency.
If you see too many signals, adjust in this order. First make sure midline reset is on, since it is by far the strongest control. Then raise the minimum bar gap. Then move the inner levels further out, for example resistance from 68 to 72 and support from 35 to 30. Only lengthen the RSI period as a last step, since that changes the character of the oscillator itself.
If you want more signals, turn midline reset off and reduce the reset buffer.
Timeframes.
On very fast charts, use the confirmation pair as your primary signals and treat the inner pair as context. On higher timeframes all four levels become meaningful, because each touch represents a much larger move.
Alerts.
Each of the four signal types has its own alert condition, so you can subscribe only to confirmation signals if you want a low-noise alert stream, or to all four if you want full coverage.
━━━━━━━━━━━━━━━━━━━━━━━━━━━━━━━━━━━━━━━━━━━━━━━━━━━━━━━━━━━━━━━━━━━━━━━━━━
SETTINGS
RSI SETTINGS
- RSI Length, default 14.
- RSI Source, default close.
SIGNAL LEVELS
- Overbought Level, default 80, prints CONFIRM SELL.
- Resistance Level, default 68, prints SELL.
- Support Level, default 35, prints BUY.
- Oversold Level, default 20, prints CONFIRM BUY.
- Reset Levels At Midline, on by default. The main signal-frequency control.
- Midline Level, default 50. The threshold RSI must cross for a fired level to re-arm.
- Level Reset Buffer, used only when midline reset is off.
- Minimum Bars Between Repeats, per-level guard against clustering.
SIGNAL TOGGLES
- Each of the four signal types can be enabled or disabled independently, so you can run the tool as a confirmation-only system if you prefer.
LABELS
- Show Labels On Price Chart and Show Labels On RSI Pane, independently toggleable.
- Max Labels To Keep, oldest labels are retired automatically once exceeded.
- Label Size, and fully editable text for all four signal types.
RSI LINE COLOURING
- Colour Smoothing, reduces colour flicker on small wiggles.
- Smoothing Length and RSI Line Width.
STYLE
- Bullish and bearish colours, buy and sell label colours, label text colour, level line colour and thickness, level line and level name visibility.
━━━━━━━━━━━━━━━━━━━━━━━━━━━━━━━━━━━━━━━━━━━━━━━━━━━━━━━━━━━━━━━━━━━━━━━━━━
UNIVERSAL MARKET AND TIMEFRAME COMPATIBILITY
RSI is a bounded zero to one hundred oscillator by construction, so no volatility or price scaling is required anywhere in this tool. Nothing in the logic references a raw price value, a pip size, a point distance or an instrument-specific constant. All calculations live entirely inside RSI's own domain.
The consequence is that the same four levels are valid on Forex majors and exotics, on gold and other metals, on indices, on crypto and on individual equities, from one-minute charts up to monthly, with no adjustment for any of them. Price-chart labels use automatic above-bar and below-bar anchoring, so they position correctly regardless of the instrument's price magnitude.
No request.security call is used anywhere in the script, so there is no higher-timeframe dependency and no associated lookahead risk of any kind.
━━━━━━━━━━━━━━━━━━━━━━━━━━━━━━━━━━━━━━━━━━━━━━━━━━━━━━━━━━━━━━━━━━━━━━━━━━
ALERTS
Four alert conditions are included:
- RSI Overbought, Confirm Sell
- RSI Resistance, Sell
- RSI Oversold, Confirm Buy
- RSI Support, Buy
Alert messages carry the ticker and timeframe automatically, so the same alert can be run across an entire watchlist without keeping charts open.
━━━━━━━━━━━━━━━━━━━━━━━━━━━━━━━━━━━━━━━━━━━━━━━━━━━━━━━━━━━━━━━━━━━━━━━━━━
REAL-TIME BEHAVIOUR, PLEASE READ
This is a live-signal tool by design. Level touches are evaluated on the currently forming bar rather than being gated behind bar close, so a signal appears the moment RSI reaches a level instead of one full bar later.
The trade-off is standard and expected for any live oscillator tool, and it is stated here openly. On the last, still-forming bar a signal can appear and then withdraw if RSI falls back below the level before that bar closes. Once a bar has closed, its signals are final and never change afterwards.
This is intended behaviour rather than a fault, and it is the direct cost of getting the signal in real time instead of one bar late. Traders who prefer only settled signals can simply act on closed candles and treat anything on the forming bar as provisional.
━━━━━━━━━━━━━━━━━━━━━━━━━━━━━━━━━━━━━━━━━━━━━━━━━━━━━━━━━━━━━━━━━━━━━━━━━━
HONEST LIMITATIONS
- RSI levels are momentum readings, not reversal guarantees. In a strong trend the oscillator can hold above the overbought level or below the oversold level for a long time, and counter-trend signals during those periods will be poor. This is a property of every oscillator ever built, not a defect in this implementation.
- The tool deliberately contains no trend filter. It reports what momentum did, accurately and consistently. Deciding whether the surrounding context supports acting on that report remains the trader's job.
- Midline reset reduces signal count substantially, which is its purpose, but it also means a genuine second opportunity within the same swing will not be labelled. If you want every level reaction, switch the reset mode.
- Signals are level-based, so they inherit the natural lag of any smoothed oscillator. A shorter RSI length responds faster but produces more noise. There is no setting that removes this trade-off.
- This indicator identifies momentum conditions. It does not size positions, does not manage risk and does not predict direction. All trading decisions remain entirely your own.
━━━━━━━━━━━━━━━━━━━━━━━━━━━━━━━━━━━━━━━━━━━━━━━━━━━━━━━━━━━━━━━━━━━━━━━━━━
AUTHOR VERIFICATION DECLARATION
I am Forex_Market_Insights, the publisher and sole original author of this exact implementation of RSI Trade Entries. I designed the structure of this tool, wrote every line of the Pine Script v6 code it contains, tested it across multiple asset classes and timeframes, and I take full and sole ownership and responsibility for it.
Specifically, I independently designed and coded: the four-level signal architecture and the distinct roles I assigned to each level, being deep overbought, early resistance, early support and deep oversold; the touch and cross detection routine; the per-level arming and hysteresis state machine, including the midline reset mode that limits output to roughly one signal per momentum swing; the dynamic bullish and bearish segment colouring of the RSI line together with its optional slope-smoothing variant; the dual-pane labelling system that mirrors every signal onto the candlestick chart using forced overlay placement; the label registry with automatic retirement of the oldest drawings; and the complete alert framework. The visual language of the tool, meaning the wording of the four signal labels, their colour scheme, their placement above or below price, and the on-pane level naming, was designed by me.
This declaration is made for this specific version of the script, version 6.0, July 2026. Any future modified version I publish will carry its own updated declaration in the script header.
━━━━━━━━━━━━━━━━━━━━━━━━━━━━━━━━━━━━━━━━━━━━━━━━━━━━━━━━━━━━━━━━━━━━━━━━━━
ORIGINAL SCRIPT IMPLEMENTATION VERIFICATION AND DECLARATION
I verify and declare that this script is an original implementation authored from scratch by Forex_Market_Insights. No portion of this code was copied, ported, decompiled, translated, reverse-engineered or adapted from any other author's closed-source, invite-only, protected or open-source script. No third-party library and no republished open-source script forms any part of this work, and no other author's visual or labelling system was reproduced.
I acknowledge openly and specifically that the Relative Strength Index formula itself is not mine. RSI is J. Welles Wilder Jr.'s publicly documented and universally taught momentum oscillator, published in 1978, and it is available in Pine Script as the standard built-in function. That public formula is the only pre-existing element used here, and it is used as a raw numerical input in exactly the way any developer calls a standard library function.
Everything built on top of that number is my own: the level architecture, the signal conditions, the anti-repeat state machine and its midline reset logic, the dual-pane label system, the dynamic line colouring, the drawing lifecycle management and the alert design. Conceptual overlap with other tools that also plot RSI is therefore unavoidable and expected, but there is no source-code overlap of any kind with any other author's work.
The full commented source, including both of these declarations, is contained in the script header.
━━━━━━━━━━━━━━━━━━━━━━━━━━━━━━━━━━━━━━━━━━━━━━━━━━━━━━━━━━━━━━━━━━━━━━━━━━
DISCLAIMER
This tool is for educational and informational purposes only. It does not constitute financial advice. Trading involves risk and past patterns do not guarantee future results. No signal produced by this indicator is a recommendation to enter or exit any position. Use proper risk management, test thoroughly on your own instruments and timeframes, and consult a licensed financial advisor before trading real capital. All trading decisions and all risk taken remain entirely your own responsibility.
tradingview.com/u/Forex_Market_Insights/
tradingview.com/u/Forex_Market_Insights/
OVERVIEW
RSI Trade Entries turns the Relative Strength Index into a direct, readable entry-signal tool by dividing the oscillator into four decision levels instead of the usual two, and by printing every signal in two places at once: in the RSI pane where the level was touched, and on the candlestick chart at the same bar.
The four levels are not four copies of the same idea. They are two pairs with different jobs.
Overbought, default 80, prints CONFIRM SELL. This is a momentum extreme.
Resistance, default 68, prints SELL. This is the first meaningful overbought reaction.
Support, default 35, prints BUY. This is the first meaningful oversold reaction.
Oversold, default 20, prints CONFIRM BUY. This is a downside momentum extreme.
The inner pair are reached often and mark early reactions. The outer pair are reached rarely and mark genuine exhaustion. Reading them together lets you separate a routine pullback from a real momentum extreme without interpreting anything by eye.
The RSI line itself is coloured by its own slope, green while momentum is rising and red while it is falling, so the direction of the oscillator is readable instantly without tracing the line across the pane.
━━━━━━━━━━━━━━━━━━━━━━━━━━━━━━━━━━━━━━━━━━━━━━━━━━━━━━━━━━━━━━━━━━━━━━━━━━
WHY THIS INDICATOR WAS CREATED
Four specific problems drove this build.
1. Two levels are not enough information.
The standard 70 and 30 configuration answers only one question: is the market stretched or not. It cannot tell you whether momentum has merely reacted or has genuinely exhausted itself, because both situations look identical. Splitting the oscillator into an early-reaction pair and a confirmation pair answers that question directly, and it does so with the same numbers every time rather than through subjective reading.
2. The oscillator is in the wrong place.
RSI lives in a separate pane, below price. Every time it does something meaningful the trader has to look away from the candles, interpret the oscillator, and then look back and find the bar it happened on. That constant switching is where mistakes and missed entries come from. This tool prints the signal on the price chart itself, at the exact candle, so the oscillator's message arrives where the decision is actually being made.
3. Level tools produce far too many signals.
A naive level check fires on every bar the oscillator spends beyond a line. On a one-minute chart that buries the workspace in duplicate labels and makes alerts completely unusable. What was needed was a state model where one momentum swing produces one signal, not one signal per bar and not one per re-touch of the same line during the same push.
4. Most oscillator tools are not built for live use.
Many wait for the bar to close before showing anything, which means the signal arrives after the move it was meant to catch has already started. This tool evaluates levels on the forming bar so the signal appears the moment the level is reached, with the real-time behaviour documented openly rather than hidden.
━━━━━━━━━━━━━━━━━━━━━━━━━━━━━━━━━━━━━━━━━━━━━━━━━━━━━━━━━━━━━━━━━━━━━━━━━━
HOW IT WORKS, FULL METHODOLOGY
1. THE FOUR-LEVEL ARCHITECTURE
The oscillator is divided into four decision levels, all fully adjustable, along with RSI length and RSI source.
When RSI crosses up through the Overbought level, the tool prints CONFIRM SELL. Momentum has pushed to an extreme where continuation becomes statistically harder to sustain.
When RSI crosses up through the Resistance level, the tool prints SELL. This is the earlier, more frequent reaction level, reached long before true exhaustion.
When RSI crosses down through the Support level, the tool prints BUY. This is the mirror of Resistance on the downside.
When RSI crosses down through the Oversold level, the tool prints CONFIRM BUY. Downside momentum has reached an extreme.
Because each level carries its own independent state, a single strong push can legitimately produce a SELL at Resistance on the way up and then a CONFIRM SELL at Overbought if the push continues. Those are two different pieces of information about the same move, not a duplicate signal.
2. THE ANTI-REPEAT STATE MACHINE
This is the component that controls signal frequency, and it is the difference between a usable tool and a cluttered one.
Each of the four levels carries an armed or disarmed state. A level fires once when it is crossed, then immediately disarms itself. How it re-arms is what you control.
Midline reset, the default and recommended mode.
A level that has fired stays completely silent until RSI travels back across the midline, default 50. An overbought or resistance signal therefore cannot repeat until momentum has genuinely rotated back down through neutral, and a support or oversold signal cannot repeat until momentum has rotated back up. The practical result is roughly one signal per momentum swing rather than one per level touch. This is what keeps fast intraday charts readable.
Buffer reset.
With midline reset turned off, a level re-arms as soon as RSI pulls back past it by the configured buffer in RSI points. This produces considerably more signals and suits traders who want to see every level reaction rather than only swing-level ones.
On top of both modes, a per-level minimum bar gap acts as a final guard against clustering, blocking the same level from firing twice within a set number of bars.
3. THE DUAL-PANE LABEL SYSTEM
Every signal is drawn twice, from the same trigger, on the same bar.
In the RSI pane, the label is placed at the exact oscillator value where the level was touched, above the line for sell signals and below it for buy signals.
On the candlestick chart, the identical label is placed at the same bar, above the candle for sell signals and below it for buy signals. This is achieved from a single script using forced overlay placement, so you install one indicator, not two, and the two panes can never fall out of sync.
Price-chart labels are anchored using automatic above-bar and below-bar positioning rather than calculated price offsets. That means they sit correctly on an instrument priced at 0.65 and on one priced at 95,000, with no configuration.
Label text is fully editable, so you can replace CONFIRM SELL, SELL, BUY and CONFIRM BUY with your own wording if you prefer.
4. DYNAMIC LINE COLOURING
The RSI line is plotted with per-segment colour driven by its own slope. Rising momentum is drawn in the bullish colour, falling momentum in the bearish colour. Turning points are therefore visible as colour changes rather than as shape changes you have to trace.
Because a raw one-bar slope can flicker on tiny wiggles, an optional colour smoothing mode applies a short EMA to the slope before deciding the colour. Turn it on if you prefer clean colour blocks, leave it off if you want maximum responsiveness.
5. LEVEL VISUALISATION
All four levels are drawn as solid reference lines in the pane with adjustable colour and thickness, each labelled by name on the right so you always know which line is which. A faint dotted midline shows where the reset threshold sits, so you can see at a glance whether a level has re-armed yet.
━━━━━━━━━━━━━━━━━━━━━━━━━━━━━━━━━━━━━━━━━━━━━━━━━━━━━━━━━━━━━━━━━━━━━━━━━━
HOW TO READ IT ON THE CHART
- Green RSI segment means momentum is rising. Red means it is falling.
- SELL means RSI has reached the resistance level. The first overbought reaction of this swing.
- CONFIRM SELL means RSI has pushed all the way to the overbought extreme. A stronger reading than SELL.
- BUY means RSI has reached the support level. The first oversold reaction of this swing.
- CONFIRM BUY means RSI has reached the oversold extreme. A stronger reading than BUY.
- The same label always appears on both the price chart and the oscillator pane at the same candle.
- The dotted midline is the reset threshold. Until RSI crosses it, fired levels stay silent.
━━━━━━━━━━━━━━━━━━━━━━━━━━━━━━━━━━━━━━━━━━━━━━━━━━━━━━━━━━━━━━━━━━━━━━━━━━
PRACTICAL USE
Reading the two tiers.
Treat SELL and BUY as attention signals and CONFIRM SELL and CONFIRM BUY as conviction signals. A SELL that never becomes a CONFIRM SELL usually marks a shallow pullback inside a trend. A SELL followed by a CONFIRM SELL on the same push describes a market that has driven momentum to an extreme, which is where reactions tend to be larger.
Trading with trend context.
Oscillator levels are strongest when they agree with structure. In an established uptrend, the BUY and CONFIRM BUY signals mark pullback entries in the direction of the trend, while SELL signals mostly mark exits or partial profit-taking rather than reversals. In a downtrend the roles invert. The tool deliberately does not impose a trend filter on you, because that judgement belongs with the trader and the surrounding chart.
Ranging markets.
In a genuine range, all four levels behave closest to their textbook meaning, and CONFIRM signals at the range extremes are the highest-quality readings the tool produces.
Controlling frequency.
If you see too many signals, adjust in this order. First make sure midline reset is on, since it is by far the strongest control. Then raise the minimum bar gap. Then move the inner levels further out, for example resistance from 68 to 72 and support from 35 to 30. Only lengthen the RSI period as a last step, since that changes the character of the oscillator itself.
If you want more signals, turn midline reset off and reduce the reset buffer.
Timeframes.
On very fast charts, use the confirmation pair as your primary signals and treat the inner pair as context. On higher timeframes all four levels become meaningful, because each touch represents a much larger move.
Alerts.
Each of the four signal types has its own alert condition, so you can subscribe only to confirmation signals if you want a low-noise alert stream, or to all four if you want full coverage.
━━━━━━━━━━━━━━━━━━━━━━━━━━━━━━━━━━━━━━━━━━━━━━━━━━━━━━━━━━━━━━━━━━━━━━━━━━
SETTINGS
RSI SETTINGS
- RSI Length, default 14.
- RSI Source, default close.
SIGNAL LEVELS
- Overbought Level, default 80, prints CONFIRM SELL.
- Resistance Level, default 68, prints SELL.
- Support Level, default 35, prints BUY.
- Oversold Level, default 20, prints CONFIRM BUY.
- Reset Levels At Midline, on by default. The main signal-frequency control.
- Midline Level, default 50. The threshold RSI must cross for a fired level to re-arm.
- Level Reset Buffer, used only when midline reset is off.
- Minimum Bars Between Repeats, per-level guard against clustering.
SIGNAL TOGGLES
- Each of the four signal types can be enabled or disabled independently, so you can run the tool as a confirmation-only system if you prefer.
LABELS
- Show Labels On Price Chart and Show Labels On RSI Pane, independently toggleable.
- Max Labels To Keep, oldest labels are retired automatically once exceeded.
- Label Size, and fully editable text for all four signal types.
RSI LINE COLOURING
- Colour Smoothing, reduces colour flicker on small wiggles.
- Smoothing Length and RSI Line Width.
STYLE
- Bullish and bearish colours, buy and sell label colours, label text colour, level line colour and thickness, level line and level name visibility.
━━━━━━━━━━━━━━━━━━━━━━━━━━━━━━━━━━━━━━━━━━━━━━━━━━━━━━━━━━━━━━━━━━━━━━━━━━
UNIVERSAL MARKET AND TIMEFRAME COMPATIBILITY
RSI is a bounded zero to one hundred oscillator by construction, so no volatility or price scaling is required anywhere in this tool. Nothing in the logic references a raw price value, a pip size, a point distance or an instrument-specific constant. All calculations live entirely inside RSI's own domain.
The consequence is that the same four levels are valid on Forex majors and exotics, on gold and other metals, on indices, on crypto and on individual equities, from one-minute charts up to monthly, with no adjustment for any of them. Price-chart labels use automatic above-bar and below-bar anchoring, so they position correctly regardless of the instrument's price magnitude.
No request.security call is used anywhere in the script, so there is no higher-timeframe dependency and no associated lookahead risk of any kind.
━━━━━━━━━━━━━━━━━━━━━━━━━━━━━━━━━━━━━━━━━━━━━━━━━━━━━━━━━━━━━━━━━━━━━━━━━━
ALERTS
Four alert conditions are included:
- RSI Overbought, Confirm Sell
- RSI Resistance, Sell
- RSI Oversold, Confirm Buy
- RSI Support, Buy
Alert messages carry the ticker and timeframe automatically, so the same alert can be run across an entire watchlist without keeping charts open.
━━━━━━━━━━━━━━━━━━━━━━━━━━━━━━━━━━━━━━━━━━━━━━━━━━━━━━━━━━━━━━━━━━━━━━━━━━
REAL-TIME BEHAVIOUR, PLEASE READ
This is a live-signal tool by design. Level touches are evaluated on the currently forming bar rather than being gated behind bar close, so a signal appears the moment RSI reaches a level instead of one full bar later.
The trade-off is standard and expected for any live oscillator tool, and it is stated here openly. On the last, still-forming bar a signal can appear and then withdraw if RSI falls back below the level before that bar closes. Once a bar has closed, its signals are final and never change afterwards.
This is intended behaviour rather than a fault, and it is the direct cost of getting the signal in real time instead of one bar late. Traders who prefer only settled signals can simply act on closed candles and treat anything on the forming bar as provisional.
━━━━━━━━━━━━━━━━━━━━━━━━━━━━━━━━━━━━━━━━━━━━━━━━━━━━━━━━━━━━━━━━━━━━━━━━━━
HONEST LIMITATIONS
- RSI levels are momentum readings, not reversal guarantees. In a strong trend the oscillator can hold above the overbought level or below the oversold level for a long time, and counter-trend signals during those periods will be poor. This is a property of every oscillator ever built, not a defect in this implementation.
- The tool deliberately contains no trend filter. It reports what momentum did, accurately and consistently. Deciding whether the surrounding context supports acting on that report remains the trader's job.
- Midline reset reduces signal count substantially, which is its purpose, but it also means a genuine second opportunity within the same swing will not be labelled. If you want every level reaction, switch the reset mode.
- Signals are level-based, so they inherit the natural lag of any smoothed oscillator. A shorter RSI length responds faster but produces more noise. There is no setting that removes this trade-off.
- This indicator identifies momentum conditions. It does not size positions, does not manage risk and does not predict direction. All trading decisions remain entirely your own.
━━━━━━━━━━━━━━━━━━━━━━━━━━━━━━━━━━━━━━━━━━━━━━━━━━━━━━━━━━━━━━━━━━━━━━━━━━
AUTHOR VERIFICATION DECLARATION
I am Forex_Market_Insights, the publisher and sole original author of this exact implementation of RSI Trade Entries. I designed the structure of this tool, wrote every line of the Pine Script v6 code it contains, tested it across multiple asset classes and timeframes, and I take full and sole ownership and responsibility for it.
Specifically, I independently designed and coded: the four-level signal architecture and the distinct roles I assigned to each level, being deep overbought, early resistance, early support and deep oversold; the touch and cross detection routine; the per-level arming and hysteresis state machine, including the midline reset mode that limits output to roughly one signal per momentum swing; the dynamic bullish and bearish segment colouring of the RSI line together with its optional slope-smoothing variant; the dual-pane labelling system that mirrors every signal onto the candlestick chart using forced overlay placement; the label registry with automatic retirement of the oldest drawings; and the complete alert framework. The visual language of the tool, meaning the wording of the four signal labels, their colour scheme, their placement above or below price, and the on-pane level naming, was designed by me.
This declaration is made for this specific version of the script, version 6.0, July 2026. Any future modified version I publish will carry its own updated declaration in the script header.
━━━━━━━━━━━━━━━━━━━━━━━━━━━━━━━━━━━━━━━━━━━━━━━━━━━━━━━━━━━━━━━━━━━━━━━━━━
ORIGINAL SCRIPT IMPLEMENTATION VERIFICATION AND DECLARATION
I verify and declare that this script is an original implementation authored from scratch by Forex_Market_Insights. No portion of this code was copied, ported, decompiled, translated, reverse-engineered or adapted from any other author's closed-source, invite-only, protected or open-source script. No third-party library and no republished open-source script forms any part of this work, and no other author's visual or labelling system was reproduced.
I acknowledge openly and specifically that the Relative Strength Index formula itself is not mine. RSI is J. Welles Wilder Jr.'s publicly documented and universally taught momentum oscillator, published in 1978, and it is available in Pine Script as the standard built-in function. That public formula is the only pre-existing element used here, and it is used as a raw numerical input in exactly the way any developer calls a standard library function.
Everything built on top of that number is my own: the level architecture, the signal conditions, the anti-repeat state machine and its midline reset logic, the dual-pane label system, the dynamic line colouring, the drawing lifecycle management and the alert design. Conceptual overlap with other tools that also plot RSI is therefore unavoidable and expected, but there is no source-code overlap of any kind with any other author's work.
The full commented source, including both of these declarations, is contained in the script header.
━━━━━━━━━━━━━━━━━━━━━━━━━━━━━━━━━━━━━━━━━━━━━━━━━━━━━━━━━━━━━━━━━━━━━━━━━━
DISCLAIMER
This tool is for educational and informational purposes only. It does not constitute financial advice. Trading involves risk and past patterns do not guarantee future results. No signal produced by this indicator is a recommendation to enter or exit any position. Use proper risk management, test thoroughly on your own instruments and timeframes, and consult a licensed financial advisor before trading real capital. All trading decisions and all risk taken remain entirely your own responsibility.
tradingview.com/u/Forex_Market_Insights/
Skrypt open-source
W zgodzie z duchem TradingView twórca tego skryptu udostępnił go jako open-source, aby użytkownicy mogli przejrzeć i zweryfikować jego działanie. Ukłony dla autora. Korzystanie jest bezpłatne, jednak ponowna publikacja kodu podlega naszym Zasadom serwisu.

Join My VIP Free Signals Channel.✅
telegram.me/+ZNhfjlhXP3s4OWI1
For Daily LIVE Trades,
Join Free Telegram Channel ✅
telegram.me/+ZNhfjlhXP3s4OWI1
telegram.me/+ZNhfjlhXP3s4OWI1
For Daily LIVE Trades,
Join Free Telegram Channel ✅
telegram.me/+ZNhfjlhXP3s4OWI1
Wyłączenie odpowiedzialności
Informacje i publikacje nie stanowią i nie powinny być traktowane jako porady finansowe, inwestycyjne, tradingowe ani jakiekolwiek inne rekomendacje dostarczane lub zatwierdzone przez TradingView. Więcej informacji znajduje się w Warunkach użytkowania.
Skrypt open-source
W zgodzie z duchem TradingView twórca tego skryptu udostępnił go jako open-source, aby użytkownicy mogli przejrzeć i zweryfikować jego działanie. Ukłony dla autora. Korzystanie jest bezpłatne, jednak ponowna publikacja kodu podlega naszym Zasadom serwisu.
Join My VIP Free Signals Channel.✅
telegram.me/+ZNhfjlhXP3s4OWI1
For Daily LIVE Trades,
Join Free Telegram Channel ✅
telegram.me/+ZNhfjlhXP3s4OWI1
telegram.me/+ZNhfjlhXP3s4OWI1
For Daily LIVE Trades,
Join Free Telegram Channel ✅
telegram.me/+ZNhfjlhXP3s4OWI1
Wyłączenie odpowiedzialności
Informacje i publikacje nie stanowią i nie powinny być traktowane jako porady finansowe, inwestycyjne, tradingowe ani jakiekolwiek inne rekomendacje dostarczane lub zatwierdzone przez TradingView. Więcej informacji znajduje się w Warunkach użytkowania.