Custom Timeframe Volume Profile
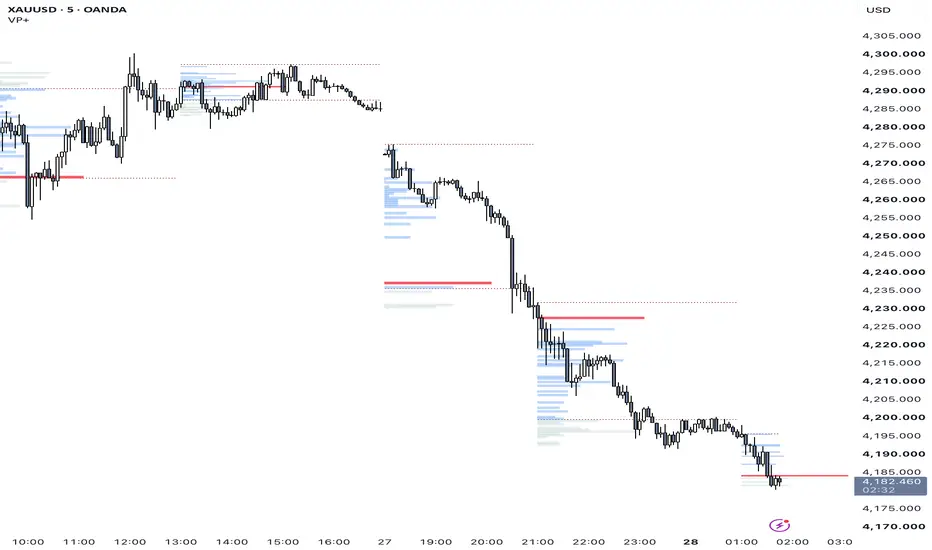
VP+ builds a volume profile for any higher timeframe you choose (4H, Daily, Weekly or anything custom) and draws it on your current chart. A new profile starts at the beginning of each HTF bar, so you can see where volume accumulated during that period and which prices the market accepted or rejected.
What it shows
Volume histogram: horizontal bars showing how much volume traded at each price level within the HTF period.
POC (Point of Control): the row with the most volume, highlighted in its own color.
Value Area: the rows containing your chosen percentage of total volume (default 70%), shaded separately from the rest of the profile.
VAH / VAL lines: the top and bottom edges of the Value Area, drawn as lines across the period.
Developing profile: the current period's profile updates live as new bars form.
How to use it
Treat the POC, VAH and VAL as reference levels. Price accepted inside the Value Area often rotates toward the POC, while a move that holds outside it can signal a shift in balance.
Prior-period VAH, VAL and POC often act as support or resistance in the next period.
Combine it with your own session, liquidity or structure levels for confluence.
Settings
HTF Period: the timeframe each profile covers.
Number of Rows: profile resolution (5–100).
Max Width (Bars): how far the longest bar extends to the right.
Value Area %: share of volume included in the Value Area.
Show Historical Profiles: keep or hide previous periods.
VAH / VAL Lines: individual toggles, colors and widths (1–10), plus a shared style (solid, dashed or dotted) and a length option (period only, or extend right).
Style: colors for the Value Area rows, outside-VA rows, POC and row borders, plus border width.
Alert: fires when a new HTF period (and so a new profile) begins.
Notes
Volume is assigned to each chart bar's close price, so accuracy depends on your chart timeframe. Lower timeframes (1m–5m) give a much finer profile than something like a 1H chart.
TradingView allows up to 500 boxes per indicator. A high row count with many historical profiles will hit that limit, and the oldest profiles will drop off. Lowering the row count or turning off historical profiles helps.
Calculation is limited to the last N bars (default 3000) to stay within Pine's history buffer. Lower it if you see a "historical offset" error.
The indicator needs volume data, so it won't work on symbols that don't provide it.
For educational purposes only. Not financial advice.
What it shows
Volume histogram: horizontal bars showing how much volume traded at each price level within the HTF period.
POC (Point of Control): the row with the most volume, highlighted in its own color.
Value Area: the rows containing your chosen percentage of total volume (default 70%), shaded separately from the rest of the profile.
VAH / VAL lines: the top and bottom edges of the Value Area, drawn as lines across the period.
Developing profile: the current period's profile updates live as new bars form.
How to use it
Treat the POC, VAH and VAL as reference levels. Price accepted inside the Value Area often rotates toward the POC, while a move that holds outside it can signal a shift in balance.
Prior-period VAH, VAL and POC often act as support or resistance in the next period.
Combine it with your own session, liquidity or structure levels for confluence.
Settings
HTF Period: the timeframe each profile covers.
Number of Rows: profile resolution (5–100).
Max Width (Bars): how far the longest bar extends to the right.
Value Area %: share of volume included in the Value Area.
Show Historical Profiles: keep or hide previous periods.
VAH / VAL Lines: individual toggles, colors and widths (1–10), plus a shared style (solid, dashed or dotted) and a length option (period only, or extend right).
Style: colors for the Value Area rows, outside-VA rows, POC and row borders, plus border width.
Alert: fires when a new HTF period (and so a new profile) begins.
Notes
Volume is assigned to each chart bar's close price, so accuracy depends on your chart timeframe. Lower timeframes (1m–5m) give a much finer profile than something like a 1H chart.
TradingView allows up to 500 boxes per indicator. A high row count with many historical profiles will hit that limit, and the oldest profiles will drop off. Lowering the row count or turning off historical profiles helps.
Calculation is limited to the last N bars (default 3000) to stay within Pine's history buffer. Lower it if you see a "historical offset" error.
The indicator needs volume data, so it won't work on symbols that don't provide it.
For educational purposes only. Not financial advice.

Luck Is What Happens When Preparation Meets Opportunity
Wyłączenie odpowiedzialności
Informacje i publikacje nie stanowią i nie powinny być traktowane jako porady finansowe, inwestycyjne, tradingowe ani jakiekolwiek inne rekomendacje dostarczane lub zatwierdzone przez TradingView. Więcej informacji znajduje się w Warunkach użytkowania.
Luck Is What Happens When Preparation Meets Opportunity
Wyłączenie odpowiedzialności
Informacje i publikacje nie stanowią i nie powinny być traktowane jako porady finansowe, inwestycyjne, tradingowe ani jakiekolwiek inne rekomendacje dostarczane lub zatwierdzone przez TradingView. Więcej informacji znajduje się w Warunkach użytkowania.