OPEN-SOURCE SCRIPT
Market Internals Dashboard ADD TICK VOLD
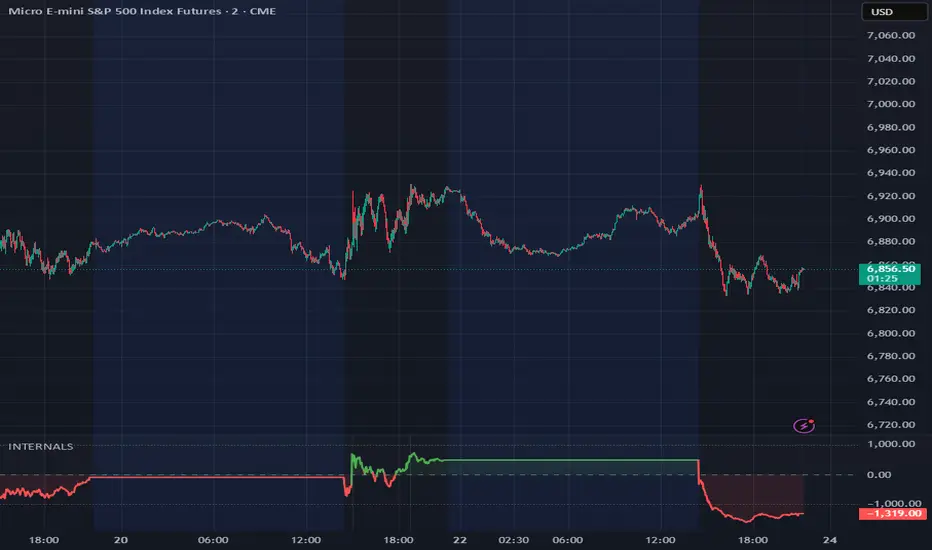
Real-time NYSE Market Internals combining Advance/Decline, Up/Down Volume, and TICK in one lower study. See breadth, volume flow, and panic/exhaustion at a glance.
📊 Market Internals Dashboard — See What the Market is REALLY Doing
Most retail traders only watch price. Institutions watch INTERNALS. This indicator puts the three most important NYSE breadth indicators into one clean lower-pane study so you can read market health in seconds.
━━━━━━━━━━━━━━━━━━━━━━━━━
🔍 WHAT IT SHOWS:
1️⃣ AADD (Advance/Decline Line) — Main Plot
• Green line = more stocks advancing (bullish breadth)
• Red line = more stocks declining (bearish breadth)
• Dotted lines at +1000 / -1000 mark extreme readings
• Zero line shows neutral — crossovers here are key signals
2️⃣ VVOLD (Up/Down Volume) — Gradient Cloud Fill
• Green shading = more volume flowing into advancing stocks
• Red shading = more volume flowing into declining stocks
• This confirms whether money is backing the move or fading it
3️⃣ TTICK (NYSE Tick) — Background Highlights
• Green background flash = TTICK above +1000 (extreme buying pressure)
• Red background flash = TTICK below -1000 (extreme selling / panic)
• No highlight = normal range, no extreme pressure
━━━━━━━━━━━━━━━━━━━━━━━━━
📈 HOW TO USE:
✅ BULLISH Setup (Look for Longs):
• AADD green and rising above zero
• Green cloud fill (VVOLD confirming volume flow)
• Green background flashes (TTICK extremes)
• All three aligned = strong institutional buying
✅ BEARISH Setup (Look for Shorts):
• AADD red and falling below zero
• Red cloud fill (VVOLD confirming selling volume)
• Red background flashes (TTICK panic prints)
• All three aligned = strong institutional selling
⚠️ MIXED / CHOPPY (Stay Cautious):
• AADD near zero, flipping back and forth
• Cloud color changing frequently
• No TTICK extremes firing
• Internals are indecisive = reduce size or sit on hands
━━━━━━━━━━━━━━━━━━━━━━━━━
💡 PRO TIPS:
• Use this alongside your price chart — internals CONFIRM or DENY what price is showing
• If price is breaking out but internals are weak/red → likely a false breakout
• If price is pulling back but internals stay green → likely a dip buy opportunity
• TTICK extremes (background flashes) are great for scalp timing on SPY/ES/NQ
• Watch for AADD crossing zero with volume confirmation — that's a momentum shift
• Best on 1-min to 15-min charts for intraday trading
━━━━━━━━━━━━━━━━━━━━━━━━━
🎯 BEST FOR:
• SPY / ES / NQ day traders
• Opening Range Breakout confirmation
• Scalpers timing entries with TTICK extremes
• Swing traders confirming trend days vs. chop days
• Anyone who wants to trade WITH institutions, not against them
━━━━━━━━━━━━━━━━━━━━━━━━━
⚙️ DATA SOURCES:
• USI:ADD — NYSE Advance/Decline Issues
• USI:VOLD — NYSE Up/Down Volume
• USI:TICK — NYSE Tick Index
All real-time NYSE breadth data. No simulations.
━━━━━━━━━━━━━━━━━━━━━━━━━
Built by theTRADINGDECK — "Stack the deck in your favor." 📈
📊 Market Internals Dashboard — See What the Market is REALLY Doing
Most retail traders only watch price. Institutions watch INTERNALS. This indicator puts the three most important NYSE breadth indicators into one clean lower-pane study so you can read market health in seconds.
━━━━━━━━━━━━━━━━━━━━━━━━━
🔍 WHAT IT SHOWS:
1️⃣ AADD (Advance/Decline Line) — Main Plot
• Green line = more stocks advancing (bullish breadth)
• Red line = more stocks declining (bearish breadth)
• Dotted lines at +1000 / -1000 mark extreme readings
• Zero line shows neutral — crossovers here are key signals
2️⃣ VVOLD (Up/Down Volume) — Gradient Cloud Fill
• Green shading = more volume flowing into advancing stocks
• Red shading = more volume flowing into declining stocks
• This confirms whether money is backing the move or fading it
3️⃣ TTICK (NYSE Tick) — Background Highlights
• Green background flash = TTICK above +1000 (extreme buying pressure)
• Red background flash = TTICK below -1000 (extreme selling / panic)
• No highlight = normal range, no extreme pressure
━━━━━━━━━━━━━━━━━━━━━━━━━
📈 HOW TO USE:
✅ BULLISH Setup (Look for Longs):
• AADD green and rising above zero
• Green cloud fill (VVOLD confirming volume flow)
• Green background flashes (TTICK extremes)
• All three aligned = strong institutional buying
✅ BEARISH Setup (Look for Shorts):
• AADD red and falling below zero
• Red cloud fill (VVOLD confirming selling volume)
• Red background flashes (TTICK panic prints)
• All three aligned = strong institutional selling
⚠️ MIXED / CHOPPY (Stay Cautious):
• AADD near zero, flipping back and forth
• Cloud color changing frequently
• No TTICK extremes firing
• Internals are indecisive = reduce size or sit on hands
━━━━━━━━━━━━━━━━━━━━━━━━━
💡 PRO TIPS:
• Use this alongside your price chart — internals CONFIRM or DENY what price is showing
• If price is breaking out but internals are weak/red → likely a false breakout
• If price is pulling back but internals stay green → likely a dip buy opportunity
• TTICK extremes (background flashes) are great for scalp timing on SPY/ES/NQ
• Watch for AADD crossing zero with volume confirmation — that's a momentum shift
• Best on 1-min to 15-min charts for intraday trading
━━━━━━━━━━━━━━━━━━━━━━━━━
🎯 BEST FOR:
• SPY / ES / NQ day traders
• Opening Range Breakout confirmation
• Scalpers timing entries with TTICK extremes
• Swing traders confirming trend days vs. chop days
• Anyone who wants to trade WITH institutions, not against them
━━━━━━━━━━━━━━━━━━━━━━━━━
⚙️ DATA SOURCES:
• USI:ADD — NYSE Advance/Decline Issues
• USI:VOLD — NYSE Up/Down Volume
• USI:TICK — NYSE Tick Index
All real-time NYSE breadth data. No simulations.
━━━━━━━━━━━━━━━━━━━━━━━━━
Built by theTRADINGDECK — "Stack the deck in your favor." 📈
Skrypt open-source
W zgodzie z duchem TradingView twórca tego skryptu udostępnił go jako open-source, aby użytkownicy mogli przejrzeć i zweryfikować jego działanie. Ukłony dla autora. Korzystanie jest bezpłatne, jednak ponowna publikacja kodu podlega naszym Zasadom serwisu.

Wyłączenie odpowiedzialności
Informacje i publikacje nie stanowią i nie powinny być traktowane jako porady finansowe, inwestycyjne, tradingowe ani jakiekolwiek inne rekomendacje dostarczane lub zatwierdzone przez TradingView. Więcej informacji znajduje się w Warunkach użytkowania.
Skrypt open-source
W zgodzie z duchem TradingView twórca tego skryptu udostępnił go jako open-source, aby użytkownicy mogli przejrzeć i zweryfikować jego działanie. Ukłony dla autora. Korzystanie jest bezpłatne, jednak ponowna publikacja kodu podlega naszym Zasadom serwisu.
Wyłączenie odpowiedzialności
Informacje i publikacje nie stanowią i nie powinny być traktowane jako porady finansowe, inwestycyjne, tradingowe ani jakiekolwiek inne rekomendacje dostarczane lub zatwierdzone przez TradingView. Więcej informacji znajduje się w Warunkach użytkowania.