OPEN-SOURCE SCRIPT
CandelaCharts - Killzone Supertrend
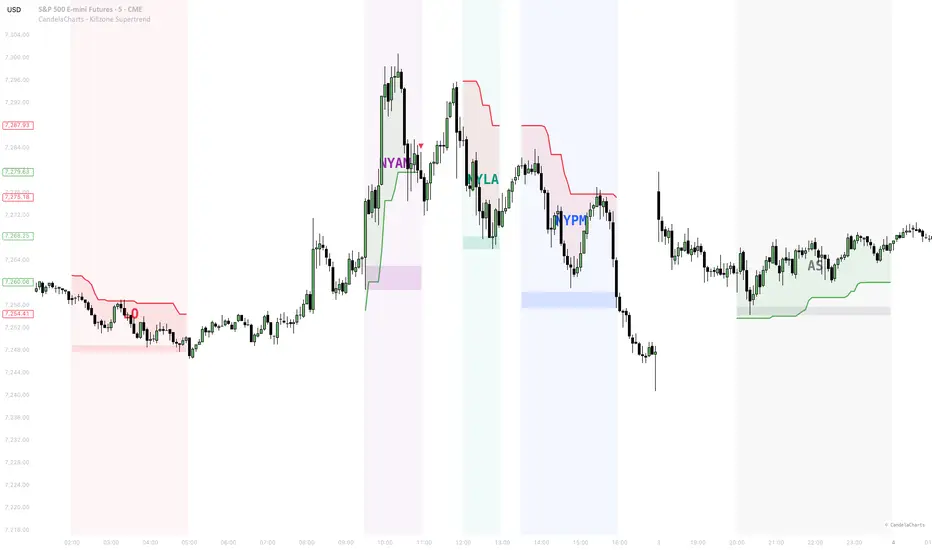
📝 Overview
The CandelaCharts - Killzone Supertrend indicator integrates professional, noise-filtered Supertrend volatility-based trend-following logic within specific intraday sessions. By isolating trend analysis to key Killzones and providing advanced smoothing tools, traders can effectively filter out market noise and identify high-probability trend shifts during periods of peak institutional activity.
📦 Features
⚙️ Settings
⚡️ Showcase
Supertrend Lines & Signals

Session Boxes & Full Backgrounds

🚨 Alerts
Trend changes are visually indicated by line color shifts and Triangle markers (Buy/Sell) within each active session.
⚠️ Disclaimer
Trading involves significant risk, and many participants may incur losses. The content on this site is not intended as financial advice and should not be interpreted as such. Decisions to buy, sell, hold, or trade securities, commodities, or other financial instruments carry inherent risks and are best made with guidance from qualified financial professionals. Past performance is not indicative of future results.
The CandelaCharts - Killzone Supertrend indicator integrates professional, noise-filtered Supertrend volatility-based trend-following logic within specific intraday sessions. By isolating trend analysis to key Killzones and providing advanced smoothing tools, traders can effectively filter out market noise and identify high-probability trend shifts during periods of peak institutional activity.
📦 Features
- 5 Customizable Sessions: Tracks trends across Asia, London, NY AM, NY Lunch, and NY PM sessions.
- Continuous Detection: Unlike standard session indicators that reset, this logic runs continuously in the background. This ensures that the trend state is established accurately before the session begins, eliminating "initialization lag."
- Full Session Backgrounds: Highlight the entire vertical pane for each session with customizable colors and transparency for maximum focus.
- Source Smoothing: Smooth the price source (hl2) before calculation to filter out minor whipsaws and reduce false signals in choppy markets.
- Multi-Method ATR: Choose between RMA, SMA, EMA, or WMA for volatility calculations based on your preferred responsiveness.
- Visual Signal Markers: Clear Triangle Up/Down markers appear instantly when a trend flip occurs within an active session.
- Trend Fill: Shaded backgrounds between the Supertrend line and price provide a visual "cushion" to assess trend strength.
- Dynamic Session Labels: Centered labels that automatically adjust their position based on the session's price range.
- Session Dividers: Clear vertical dividers to signal the transition between trading periods.
⚙️ Settings
- ATR Period: Lookback period for the Average True Range calculation (default: 10).
- Multiplier: Volatility multiplier for the trailing stop (default: 3.0).
- Source Smoothing: EMA period to smooth price before detection (0 = off).
- ATR Method: Choose the smoothing method (RMA, SMA, EMA, WMA).
- Show Signals: Toggle Triangle Up/Down markers for trend changes.
- Show Trend Fill: Toggle the shaded background between price and Supertrend.
- Label Size: Customize the text size of session labels.
- Timezone: Supports America/New_York, UTC, and Exchange time.
- Divider Style: Style and color settings for vertical lines.
- Show Session: Toggle the Supertrend logic and markers.
- Background: Toggle the full vertical pane background color.
- Session Name & Time: Define labels and time windows.
- Session Color: Sets the theme for the labels and dividers.
- Show Labels: Toggle the centered session identifiers.
- Show Divider: Toggle vertical start/end lines.
⚡️ Showcase
Supertrend Lines & Signals
Session Boxes & Full Backgrounds
🚨 Alerts
Trend changes are visually indicated by line color shifts and Triangle markers (Buy/Sell) within each active session.
⚠️ Disclaimer
Trading involves significant risk, and many participants may incur losses. The content on this site is not intended as financial advice and should not be interpreted as such. Decisions to buy, sell, hold, or trade securities, commodities, or other financial instruments carry inherent risks and are best made with guidance from qualified financial professionals. Past performance is not indicative of future results.
Skrypt open-source
W zgodzie z duchem TradingView twórca tego skryptu udostępnił go jako open-source, aby użytkownicy mogli przejrzeć i zweryfikować jego działanie. Ukłony dla autora. Korzystanie jest bezpłatne, jednak ponowna publikacja kodu podlega naszym Zasadom serwisu.

🔵 Tools that give you the edge: candelacharts.com/.
🔵 Join our free discord for updates: candelacharts.com/community
🔵 Join our free discord for updates: candelacharts.com/community
Wyłączenie odpowiedzialności
Informacje i publikacje nie stanowią i nie powinny być traktowane jako porady finansowe, inwestycyjne, tradingowe ani jakiekolwiek inne rekomendacje dostarczane lub zatwierdzone przez TradingView. Więcej informacji znajduje się w Warunkach użytkowania.
Skrypt open-source
W zgodzie z duchem TradingView twórca tego skryptu udostępnił go jako open-source, aby użytkownicy mogli przejrzeć i zweryfikować jego działanie. Ukłony dla autora. Korzystanie jest bezpłatne, jednak ponowna publikacja kodu podlega naszym Zasadom serwisu.
🔵 Tools that give you the edge: candelacharts.com/.
🔵 Join our free discord for updates: candelacharts.com/community
🔵 Join our free discord for updates: candelacharts.com/community
Wyłączenie odpowiedzialności
Informacje i publikacje nie stanowią i nie powinny być traktowane jako porady finansowe, inwestycyjne, tradingowe ani jakiekolwiek inne rekomendacje dostarczane lub zatwierdzone przez TradingView. Więcej informacji znajduje się w Warunkach użytkowania.