Zaktualizowano
Adaptive Market Structure & Fair Value
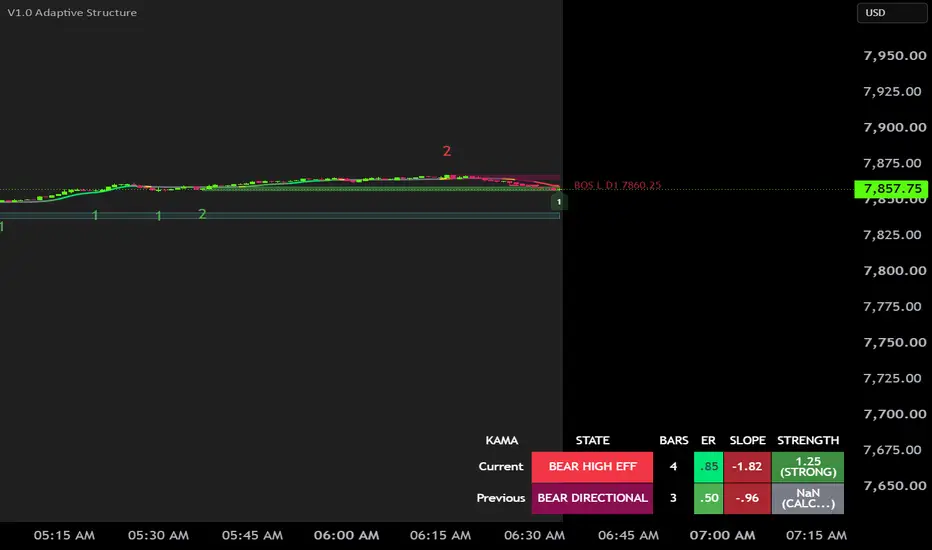
### Adaptive Market Structure & Fair Value
Adaptive Market Structure & Fair Value combines three complementary market measurements:
**Adaptive market structure**, using efficiency-adjusted pivot confirmation;
**Adaptive KAMA trend state**, using price efficiency and normalized KAMA progression;
**Session VWAP fair value**, using the direction and efficiency of VWAP migration.
The indicator is designed to distinguish structural price movement from short-term market noise rather than produce instantaneous turning-point signals.
### Adaptive Pivot Structure
Potential pivot highs and lows are identified when price exceeds the selected number of bars to the left of the candidate.
Unlike a fixed pivot algorithm, the number of right-side bars required for confirmation changes with price Efficiency Ratio (ER).
Efficient directional movement permits faster confirmation, while inefficient or noisy movement requires additional right-side evidence.
A pending candidate can therefore either:
* become a confirmed structural pivot after its required confirmation bars have elapsed, or
* disappear if price makes a more extreme high or low before confirmation.
**Pivot Caveat:** Confirmed pivots necessarily appear after the actual pivot bar. This is intentional confirmation delay, not repainting of a previously confirmed pivot. Pending candidates should not be treated as confirmed structure.
The Pivot Range Depth setting selects which surviving unbroken high/low pair defines the displayed structural zones. Increasing depth references progressively older and generally broader market structure.
### Adaptive KAMA
KAMA provides the indicator's short-term directional component.
Its responsiveness changes according to price Efficiency Ratio. Efficient movement causes KAMA to respond more quickly, while inefficient or sideways movement causes greater smoothing.
KAMA direction is not determined from price position alone. The script measures the linear-regression progression of KAMA and normalizes that movement against current market noise. Efficiency Ratio is then used to qualify how much confidence should be assigned to that progression.
The resulting states are:
* Bull High Efficiency
* Bull Directional
* Bull Transition
* Range
* Bear Transition
* Bear Directional
* Bear High Efficiency
The table displays the current state, its duration in bars, KAMA ER and normalized KAMA slope, together with the completed previous state.
### KAMA Confirmation Delay
KAMA is intentionally a confirmation tool rather than a prediction of the next price bar.
Several components contribute to its response time:
1. Efficiency Ratio is calculated across a historical lookback.
2. ER is smoothed before controlling KAMA responsiveness.
3. KAMA itself is an adaptive recursive average.
4. KAMA progression is measured using a short linear-regression slope.
5. When the optional KAMA Color Filter is enabled, major directional transitions also require price acceptance.
With the filter enabled, transitions from RANGE into a directional state and bullish-to-bearish or bearish-to-bullish reversals require price to exceed the accepted closing-price range established by the existing KAMA state.
This intentionally prevents a single minor change in slope from immediately reversing the displayed trend state.
Changes in efficiency within the same direction are not subjected to this additional acceptance delay, and deterioration back to RANGE is allowed immediately.
Consequently, the KAMA state should be interpreted as **confirmed trend condition**, not as an exact turning-point signal.
### Session VWAP Fair Value
VWAP resets at the selected session anchor and represents volume-weighted session fair value.
The indicator currently supports London and New York session anchoring.
In addition to plotting session VWAP, the script measures:
* VWAP Efficiency Ratio;
* normalized VWAP displacement;
* statistical strength of that displacement.
This allows VWAP to distinguish between simple movement in fair value and sustained directional migration.
### VWAP Warm-Up and Delay
The underlying VWAP calculation begins with the selected session and updates as new price and volume are received.
The **VWAP trend classification**, however, intentionally requires historical observations.
Early in the session, before enough bars are available for the full ER and statistical-strength calculations, the indicator uses the direction of VWAP displacement as an early directional estimate.
After sufficient observations accumulate, the classification becomes more selective and requires both:
* sufficient VWAP directional displacement; and
* VWAP Efficiency Ratio above its qualification threshold.
Therefore, the VWAP line itself should not be confused with the slower VWAP trend classification.
Higher VWAP ER lengths and smoothing values produce more stable classifications but require more bars before the full calculation becomes available.
### Important Interpretation
The Pivot, KAMA, and VWAP modules should not be expected to change simultaneously.
They measure different aspects of market behavior:
**Pivots** confirm structure after future bars establish that a swing survived.
**KAMA** confirms the quality and direction of recent price progression.
**VWAP** measures the migration of session fair value and requires session history before its stronger statistical classification is available.
A pivot may therefore form before KAMA confirms a directional change, or KAMA may become directional before VWAP has accumulated enough session data to confirm persistent fair-value migration.
This disagreement is not necessarily an error. It can represent a developing transition in market structure.
### Practical Use
The indicator is best used as a layered decision framework:
**Structure:** Where are the surviving pivot zones?
**Trend:** Is KAMA ranging, transitioning, directional, or highly efficient?
**Fair Value:** Is session VWAP migrating with the move or remaining relatively neutral?
Agreement between the three components provides stronger contextual confirmation than any individual component alone.
### Limitations
This indicator is descriptive and confirmatory. It does not predict future price movement.
Adaptive calculations necessarily introduce varying amounts of delay. Increasing ER lookbacks, smoothing lengths, pivot confirmation requirements, KAMA slow length, or structural depth will generally produce more stable information at the cost of slower response.
Pending pivots can disappear before confirmation. Confirmed pivots are historical structural references and should not be interpreted as signals that would have been known on the original pivot bar.
KAMA states may remain in the prior direction while a reversal is developing, particularly when the KAMA Color Filter is enabled.
VWAP trend classifications require sufficient bars after the selected session begins and should be considered immature during the early-session warm-up period.
The indicator should therefore be used as market context and confirmation rather than as a standalone entry or exit system.
Adaptive Market Structure & Fair Value combines three complementary market measurements:
**Adaptive market structure**, using efficiency-adjusted pivot confirmation;
**Adaptive KAMA trend state**, using price efficiency and normalized KAMA progression;
**Session VWAP fair value**, using the direction and efficiency of VWAP migration.
The indicator is designed to distinguish structural price movement from short-term market noise rather than produce instantaneous turning-point signals.
### Adaptive Pivot Structure
Potential pivot highs and lows are identified when price exceeds the selected number of bars to the left of the candidate.
Unlike a fixed pivot algorithm, the number of right-side bars required for confirmation changes with price Efficiency Ratio (ER).
Efficient directional movement permits faster confirmation, while inefficient or noisy movement requires additional right-side evidence.
A pending candidate can therefore either:
* become a confirmed structural pivot after its required confirmation bars have elapsed, or
* disappear if price makes a more extreme high or low before confirmation.
**Pivot Caveat:** Confirmed pivots necessarily appear after the actual pivot bar. This is intentional confirmation delay, not repainting of a previously confirmed pivot. Pending candidates should not be treated as confirmed structure.
The Pivot Range Depth setting selects which surviving unbroken high/low pair defines the displayed structural zones. Increasing depth references progressively older and generally broader market structure.
### Adaptive KAMA
KAMA provides the indicator's short-term directional component.
Its responsiveness changes according to price Efficiency Ratio. Efficient movement causes KAMA to respond more quickly, while inefficient or sideways movement causes greater smoothing.
KAMA direction is not determined from price position alone. The script measures the linear-regression progression of KAMA and normalizes that movement against current market noise. Efficiency Ratio is then used to qualify how much confidence should be assigned to that progression.
The resulting states are:
* Bull High Efficiency
* Bull Directional
* Bull Transition
* Range
* Bear Transition
* Bear Directional
* Bear High Efficiency
The table displays the current state, its duration in bars, KAMA ER and normalized KAMA slope, together with the completed previous state.
### KAMA Confirmation Delay
KAMA is intentionally a confirmation tool rather than a prediction of the next price bar.
Several components contribute to its response time:
1. Efficiency Ratio is calculated across a historical lookback.
2. ER is smoothed before controlling KAMA responsiveness.
3. KAMA itself is an adaptive recursive average.
4. KAMA progression is measured using a short linear-regression slope.
5. When the optional KAMA Color Filter is enabled, major directional transitions also require price acceptance.
With the filter enabled, transitions from RANGE into a directional state and bullish-to-bearish or bearish-to-bullish reversals require price to exceed the accepted closing-price range established by the existing KAMA state.
This intentionally prevents a single minor change in slope from immediately reversing the displayed trend state.
Changes in efficiency within the same direction are not subjected to this additional acceptance delay, and deterioration back to RANGE is allowed immediately.
Consequently, the KAMA state should be interpreted as **confirmed trend condition**, not as an exact turning-point signal.
### Session VWAP Fair Value
VWAP resets at the selected session anchor and represents volume-weighted session fair value.
The indicator currently supports London and New York session anchoring.
In addition to plotting session VWAP, the script measures:
* VWAP Efficiency Ratio;
* normalized VWAP displacement;
* statistical strength of that displacement.
This allows VWAP to distinguish between simple movement in fair value and sustained directional migration.
### VWAP Warm-Up and Delay
The underlying VWAP calculation begins with the selected session and updates as new price and volume are received.
The **VWAP trend classification**, however, intentionally requires historical observations.
Early in the session, before enough bars are available for the full ER and statistical-strength calculations, the indicator uses the direction of VWAP displacement as an early directional estimate.
After sufficient observations accumulate, the classification becomes more selective and requires both:
* sufficient VWAP directional displacement; and
* VWAP Efficiency Ratio above its qualification threshold.
Therefore, the VWAP line itself should not be confused with the slower VWAP trend classification.
Higher VWAP ER lengths and smoothing values produce more stable classifications but require more bars before the full calculation becomes available.
### Important Interpretation
The Pivot, KAMA, and VWAP modules should not be expected to change simultaneously.
They measure different aspects of market behavior:
**Pivots** confirm structure after future bars establish that a swing survived.
**KAMA** confirms the quality and direction of recent price progression.
**VWAP** measures the migration of session fair value and requires session history before its stronger statistical classification is available.
A pivot may therefore form before KAMA confirms a directional change, or KAMA may become directional before VWAP has accumulated enough session data to confirm persistent fair-value migration.
This disagreement is not necessarily an error. It can represent a developing transition in market structure.
### Practical Use
The indicator is best used as a layered decision framework:
**Structure:** Where are the surviving pivot zones?
**Trend:** Is KAMA ranging, transitioning, directional, or highly efficient?
**Fair Value:** Is session VWAP migrating with the move or remaining relatively neutral?
Agreement between the three components provides stronger contextual confirmation than any individual component alone.
### Limitations
This indicator is descriptive and confirmatory. It does not predict future price movement.
Adaptive calculations necessarily introduce varying amounts of delay. Increasing ER lookbacks, smoothing lengths, pivot confirmation requirements, KAMA slow length, or structural depth will generally produce more stable information at the cost of slower response.
Pending pivots can disappear before confirmation. Confirmed pivots are historical structural references and should not be interpreted as signals that would have been known on the original pivot bar.
KAMA states may remain in the prior direction while a reversal is developing, particularly when the KAMA Color Filter is enabled.
VWAP trend classifications require sufficient bars after the selected session begins and should be considered immature during the early-session warm-up period.
The indicator should therefore be used as market context and confirmation rather than as a standalone entry or exit system.
Informacje o Wersji
What’s NewDepth-Aware Break of Structure (BOS)
BOS is now tracked relative to adaptive pivot depth.
The indicator can display the most recently broken pivot at each depth up to the selected Pivot Range Depth.
BOS is confirmed using a closing-price break rather than an intrabar wick.
The deepest selected depth is used as the active BOS reference for the Structural Strength analysis.
Structural Strength Table
A new Structural Strength Table summarizes the active structural sequence using:
Pivot Range — distance and bars between the selected structural pivots.
Pivot Shape — Efficiency Ratio (ER) of the completed pivot-to-pivot move.
BOS Expansion — distance and bars traveled following the active structural break.
Retracement — current pullback distance, bars, and percentage relative to the completed structural leg.
This allows structure to be evaluated in terms of both direction and quality rather than relying only on whether a pivot was broken.
Structure / Execution Timeframe Handoff
A configurable timeframe now separates structural analysis from intraday execution tools.
Below the selected handoff timeframe:
Adaptive KAMA
Session VWAP
KAMA state/strength table
KAMA/VWAP execution signals
At and above the selected handoff timeframe:
Structural Strength analysis
Adaptive pivots and structural zones remain available across timeframes.
Adaptive Pivot Detection
Pivot confirmation continues to adapt to price efficiency using Efficiency Ratio (ER). Efficient price movement can confirm pivots more quickly, while less efficient movement requires additional confirmation.
Pending pivot candidates are displayed before confirmation when enabled. Because a candidate must survive the required number of right-side bars, confirmed pivots are intentionally delayed and should not be interpreted as real-time turning-point signals.
KAMA and Session VWAP
The execution module continues to combine:
ER-adaptive KAMA trend classification
KAMA slope and trend-efficiency measurements
Session-anchored VWAP
VWAP migration efficiency and displacement
KAMA/VWAP crossover alerts
VWAP can be anchored to the London or New York session.
Intended Use
The indicator is designed as a market-context tool rather than a standalone trade-entry system.
Higher timeframes can be used to identify structural ranges, pivot quality and breaks of structure. Lower timeframes can then use KAMA and session VWAP to evaluate shorter-term trend behavior and fair-value migration within that larger structural context.
Important Notes
Adaptive pivots require confirmation and therefore appear after the actual pivot bar. This delay is intentional and helps reduce the number of temporary pivots created by short-term price fluctuations.
KAMA and VWAP classifications also use smoothing and confirmation. They are designed to describe developing market conditions rather than predict future price movement.
As with all technical indicators, structural levels, BOS, KAMA, VWAP and Efficiency Ratio should be used as analytical context and not as guarantees of future price direction.

Wyłączenie odpowiedzialności
Informacje i publikacje nie stanowią i nie powinny być traktowane jako porady finansowe, inwestycyjne, tradingowe ani jakiekolwiek inne rekomendacje dostarczane lub zatwierdzone przez TradingView. Więcej informacji znajduje się w Warunkach użytkowania.
Wyłączenie odpowiedzialności
Informacje i publikacje nie stanowią i nie powinny być traktowane jako porady finansowe, inwestycyjne, tradingowe ani jakiekolwiek inne rekomendacje dostarczane lub zatwierdzone przez TradingView. Więcej informacji znajduje się w Warunkach użytkowania.