Open Retest Stats [Indicatr]
Open Retest Stats answers a simple question with data from the chart itself: once price has moved away from the daily or weekly open, how often does it come back to it - and how long does that usually take?
WHAT IT DOES
The daily and weekly open are reference prices that many intraday traders watch. This script tracks every period on the chart, records whether price returned to the open after leaving it, and shows the result as a retest rate, the median time to the retest and the historical chance of a retest from the current distance.
HOW IT WORKS
HOW TO USE
THE CHART
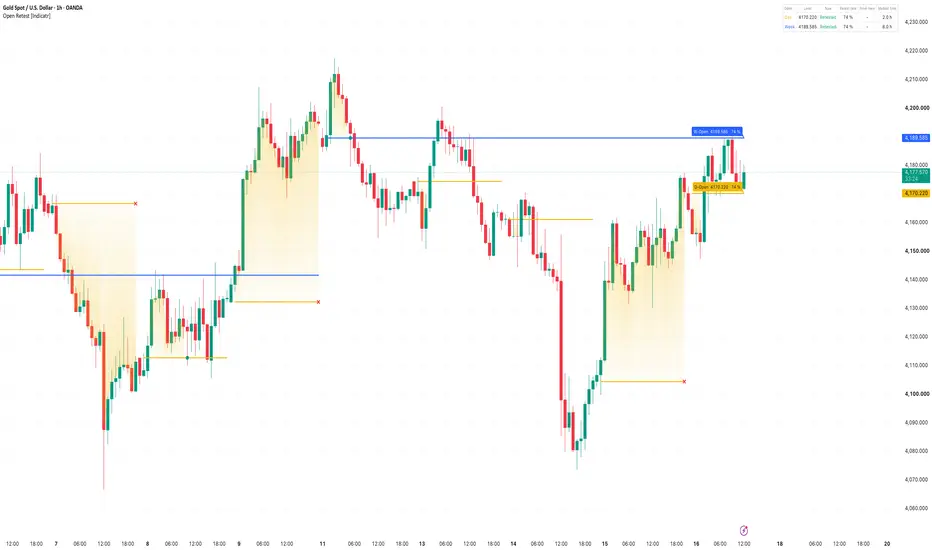
Gold (XAUUSD) 1 hour with daily and weekly open. The shaded areas show the distance while price was away from the daily open; days that ended without a retest are marked with a red cross, retests with a green dot. The labels on the right show the current daily and weekly open with their retest rates. The table shows level, current status, retest rate, chance from the current distance and median time to the retest.
WHAT IS ORIGINAL
Many scripts draw the daily open. This one measures it: a volatility-based leave filter, the retest rate per period type, the conditional probability from the current distance and the median time to the retest, all calculated on the symbol and timeframe you are looking at.
LIMITATIONS
Disclaimer
For educational and analytical purposes only. Not financial advice. Marks and signals are not buy or sell recommendations. Past behaviour does not guarantee future results.
WHAT IT DOES
The daily and weekly open are reference prices that many intraday traders watch. This script tracks every period on the chart, records whether price returned to the open after leaving it, and shows the result as a retest rate, the median time to the retest and the historical chance of a retest from the current distance.
HOW IT WORKS
- Leaving the open: a retest only counts after price has first moved away from the open by at least 0.15 x the average range of that period type (average daily range for the daily open, average weekly range for the weekly open). Without this filter almost every first bar would be a retest.
- Retest: a later bar of the same period trades through the open again.
- Statistics: for the last 250 periods the script stores whether a retest happened, the maximum distance before it and the number of bars it took.
- From here: while price is away, the table shows how often the open was retested in past periods that had moved at least as far away as the current one (shown once there are at least 10 such cases).
- No lookahead: everything is built from completed bars of the chart, nothing repaints into the past.
HOW TO USE
- Yellow line = daily open, blue line = weekly open (monthly open optional).
- The shaded gradient shows the stretch between price and the daily open while price is away and has not come back yet.
- Green dot = the open was retested. Red cross = the period ended without a retest.
- A high retest rate and a short median time can support mean-reversion ideas towards the open; a low rate from the current distance suggests a trending session - for long and short alike.
- Alerts: daily open retested, weekly open retested, monthly open retested, price left the daily open.
THE CHART
Gold (XAUUSD) 1 hour with daily and weekly open. The shaded areas show the distance while price was away from the daily open; days that ended without a retest are marked with a red cross, retests with a green dot. The labels on the right show the current daily and weekly open with their retest rates. The table shows level, current status, retest rate, chance from the current distance and median time to the retest.
WHAT IS ORIGINAL
Many scripts draw the daily open. This one measures it: a volatility-based leave filter, the retest rate per period type, the conditional probability from the current distance and the median time to the retest, all calculated on the symbol and timeframe you are looking at.
LIMITATIONS
- Daily opens depend on the session of the symbol (exchange time).
- Statistics need history; on low timeframes fewer periods are loaded, so check the sample size (hover over the retest rate).
- Past retest rates describe the past and do not predict the next session.
Disclaimer
For educational and analytical purposes only. Not financial advice. Marks and signals are not buy or sell recommendations. Past behaviour does not guarantee future results.

Indicatr - the indicators you know, rebuilt with market context: volume, trend and momentum, for long and short. Free open-source tools and Pro tools. Guides and setups: indicator.trading/en/link
Wyłączenie odpowiedzialności
Informacje i publikacje nie stanowią i nie powinny być traktowane jako porady finansowe, inwestycyjne, tradingowe ani jakiekolwiek inne rekomendacje dostarczane lub zatwierdzone przez TradingView. Więcej informacji znajduje się w Warunkach użytkowania.
Indicatr - the indicators you know, rebuilt with market context: volume, trend and momentum, for long and short. Free open-source tools and Pro tools. Guides and setups: indicator.trading/en/link
Wyłączenie odpowiedzialności
Informacje i publikacje nie stanowią i nie powinny być traktowane jako porady finansowe, inwestycyjne, tradingowe ani jakiekolwiek inne rekomendacje dostarczane lub zatwierdzone przez TradingView. Więcej informacji znajduje się w Warunkach użytkowania.