OPEN-SOURCE SCRIPT
Pre-Session Volume Delta [UK/US Open]
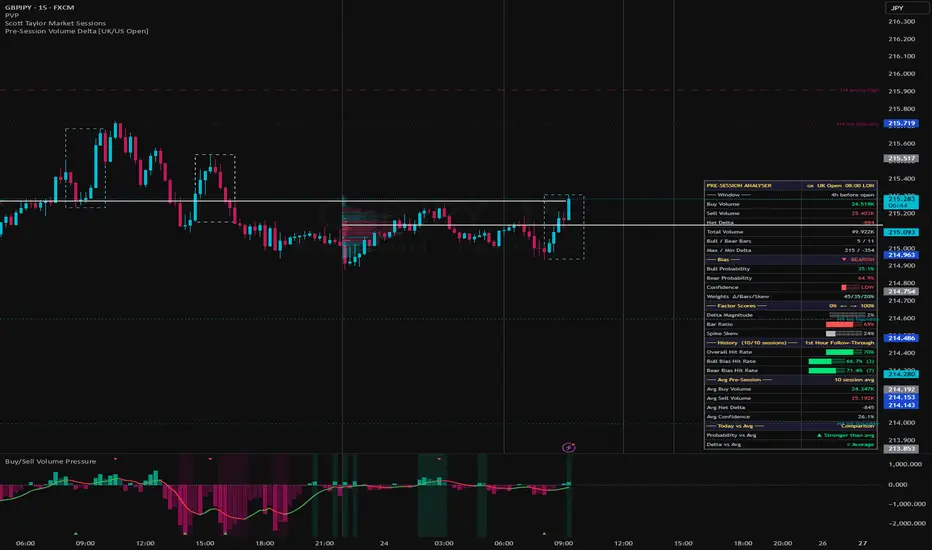
Short Description
Predict early-session market direction using institutional order flow analysis. Tracks buy/sell volume delta in the hours before UK (08:00) or US (09:30) market opens to forecast follow-through bias with confidence scoring.
Full Description
🔍 WHAT IT DOES
This indicator analyzes granular order flow (buy vs. sell volume) during the pre-market window to predict directional bias for the opening session. By measuring institutional positioning before the bell, it helps traders anticipate whether the market is likely to follow through bullish or bearish in the first hour.
⚡ KEY FEATURES
✓ Smart DST-Aware Timing — Automatically handles timezone shifts between London and New York
✓ Order Flow Delta — Calculates net buy/sell imbalance using footprint data
✓ Weighted Probability Engine — Composite confidence score from 3 factors:
• Delta Magnitude (45%) — Size of volume imbalance
• Bar Ratio (35%) — Consistency of directional bars
• Spike Skew (20%) — Quality of institutional block trades
✓ Historical Hit Rate — Tracks last 10 sessions to validate prediction accuracy
✓ Session Comparison — Today's volume vs. historical average
📊 DASHBOARD DISPLAY
• Real-time Buy/Sell volume totals
• Net Delta with directional coloring
• Bias prediction (BULLISH/BEARISH) with confidence level
• Factor score progress bars
• Session win rate statistics
🎯 BEST USED FOR
• Intraday traders planning pre-market bias
• Order flow traders tracking institutional positioning
• Session-open momentum strategies
• Validating directional conviction before key opens
⚙️ INPUTS & CUSTOMIZATION
• Target Session: UK (08:00) or US (09:30) open
• Lookback Hours: 1-12 hours of pre-session analysis (default: 4)
• Probability Weights: Adjust factor importance
• Ticks Per Row: Footprint granularity control
• Value Area %: Volume profile threshold
📈 HOW TO READ
GREEN Net Delta + BULLISH Bias = Expect upside follow-through
RED Net Delta + BEARISH Bias = Expect downside follow-through
Confidence Rating: Low (<50%), Medium (50-70%), High (>70%)
🔔 HIT RATE TRACKING
A "Hit" is recorded when price moves in the predicted direction during the first hour of the session. Monitor the dashboard stats to gauge current reliability.
📝 NOTES
• Requires volume/footprint data (works on forex, futures, indices)
• Best on 15m-1H charts
• Higher confidence = stronger conviction, not guarantee
• Use with other confluence factors (S/R, trend, news)
--
Developed for traders who want to see what "Smart Money" is doing before the bell rings.
📖 User Guide
Getting Started
Add to Chart — Click "Add to Chart" on the indicator
Select Your Session — In settings, choose UK (London) or US (New York) open
Adjust Lookback — Default 4 hours; increase for more data, decrease for recent bias only
Position Dashboard — Toggle between Top-Right or Bottom-Right display
Dashboard Explained
Section What It Shows
Pre-Session Window Start/end times of the analysis period
Volume Metrics Buy Vol / Sell Vol / Net Delta (color-coded)
Bias Prediction Direction + Confidence % + Visual meter
Factor Scores Individual scores (0-100) for each weighting factor
Session History Last 10 predictions with hit/miss tracking
Comparison Today's delta vs. historical average
Understanding the Bias Prediction
Confidence Interpretation Action
Low (<50%) Weak conviction, mixed signals Wait for clarity or reduce size
Medium (50-70%) Moderate directional edge Trade with standard risk
High (>70%) Strong institutional positioning Higher confidence in directional setup
The Three Factors
Delta Magnitude — How large is the net buy/sell imbalance?
Higher = more conviction
Weight: 45% (default)
Bar Ratio — How many bars were bullish vs. bearish?
Measures consistency, not just size
Weight: 35% (default)
Spike Skew — Were the largest volume spikes buying or selling?
Catches institutional block trades
Weight: 20% (default)
Hit Rate Tracking
Bullish Hit Rate — % of bullish predictions that succeeded
Bearish Hit Rate — % of bearish predictions that succeeded
Overall — Combined accuracy across all predictions
A "Hit" = price moved in predicted direction during the first hour of the session
Pro Tips
✓ Combine with price action — Look for the bias to align with your S/R levels or trend direction
✓ Watch for extremes — Very high delta readings often mean early exhaustion; medium-high is the sweet spot
✓ Check both sessions — Compare UK vs. US bias for confluence or divergence
✓ Monitor your hit rate — If bearish predictions are performing better recently, weight those more heavily
✓ Adjust for volatility — In low-vol periods, reduce lookback hours to capture only recent flow
Settings Reference
Setting Default Range Purpose
Target Session US UK/US Which market open to analyze
Lookback Hours 4 1-12 Pre-session analysis window
Delta Weight 45 0-100 Importance of volume magnitude
Ratio Weight 35 0-100 Importance of bar consistency
Skew Weight 35 0-100 Importance of spike quality
Ticks Per Row 50 1-500 Footprint granularity
Value Area % 70 50-95 Volume profile threshold
Dashboard Position Bottom Right Top/Bottom Table placement
Predict early-session market direction using institutional order flow analysis. Tracks buy/sell volume delta in the hours before UK (08:00) or US (09:30) market opens to forecast follow-through bias with confidence scoring.
Full Description
🔍 WHAT IT DOES
This indicator analyzes granular order flow (buy vs. sell volume) during the pre-market window to predict directional bias for the opening session. By measuring institutional positioning before the bell, it helps traders anticipate whether the market is likely to follow through bullish or bearish in the first hour.
⚡ KEY FEATURES
✓ Smart DST-Aware Timing — Automatically handles timezone shifts between London and New York
✓ Order Flow Delta — Calculates net buy/sell imbalance using footprint data
✓ Weighted Probability Engine — Composite confidence score from 3 factors:
• Delta Magnitude (45%) — Size of volume imbalance
• Bar Ratio (35%) — Consistency of directional bars
• Spike Skew (20%) — Quality of institutional block trades
✓ Historical Hit Rate — Tracks last 10 sessions to validate prediction accuracy
✓ Session Comparison — Today's volume vs. historical average
📊 DASHBOARD DISPLAY
• Real-time Buy/Sell volume totals
• Net Delta with directional coloring
• Bias prediction (BULLISH/BEARISH) with confidence level
• Factor score progress bars
• Session win rate statistics
🎯 BEST USED FOR
• Intraday traders planning pre-market bias
• Order flow traders tracking institutional positioning
• Session-open momentum strategies
• Validating directional conviction before key opens
⚙️ INPUTS & CUSTOMIZATION
• Target Session: UK (08:00) or US (09:30) open
• Lookback Hours: 1-12 hours of pre-session analysis (default: 4)
• Probability Weights: Adjust factor importance
• Ticks Per Row: Footprint granularity control
• Value Area %: Volume profile threshold
📈 HOW TO READ
GREEN Net Delta + BULLISH Bias = Expect upside follow-through
RED Net Delta + BEARISH Bias = Expect downside follow-through
Confidence Rating: Low (<50%), Medium (50-70%), High (>70%)
🔔 HIT RATE TRACKING
A "Hit" is recorded when price moves in the predicted direction during the first hour of the session. Monitor the dashboard stats to gauge current reliability.
📝 NOTES
• Requires volume/footprint data (works on forex, futures, indices)
• Best on 15m-1H charts
• Higher confidence = stronger conviction, not guarantee
• Use with other confluence factors (S/R, trend, news)
--
Developed for traders who want to see what "Smart Money" is doing before the bell rings.
📖 User Guide
Getting Started
Add to Chart — Click "Add to Chart" on the indicator
Select Your Session — In settings, choose UK (London) or US (New York) open
Adjust Lookback — Default 4 hours; increase for more data, decrease for recent bias only
Position Dashboard — Toggle between Top-Right or Bottom-Right display
Dashboard Explained
Section What It Shows
Pre-Session Window Start/end times of the analysis period
Volume Metrics Buy Vol / Sell Vol / Net Delta (color-coded)
Bias Prediction Direction + Confidence % + Visual meter
Factor Scores Individual scores (0-100) for each weighting factor
Session History Last 10 predictions with hit/miss tracking
Comparison Today's delta vs. historical average
Understanding the Bias Prediction
Confidence Interpretation Action
Low (<50%) Weak conviction, mixed signals Wait for clarity or reduce size
Medium (50-70%) Moderate directional edge Trade with standard risk
High (>70%) Strong institutional positioning Higher confidence in directional setup
The Three Factors
Delta Magnitude — How large is the net buy/sell imbalance?
Higher = more conviction
Weight: 45% (default)
Bar Ratio — How many bars were bullish vs. bearish?
Measures consistency, not just size
Weight: 35% (default)
Spike Skew — Were the largest volume spikes buying or selling?
Catches institutional block trades
Weight: 20% (default)
Hit Rate Tracking
Bullish Hit Rate — % of bullish predictions that succeeded
Bearish Hit Rate — % of bearish predictions that succeeded
Overall — Combined accuracy across all predictions
A "Hit" = price moved in predicted direction during the first hour of the session
Pro Tips
✓ Combine with price action — Look for the bias to align with your S/R levels or trend direction
✓ Watch for extremes — Very high delta readings often mean early exhaustion; medium-high is the sweet spot
✓ Check both sessions — Compare UK vs. US bias for confluence or divergence
✓ Monitor your hit rate — If bearish predictions are performing better recently, weight those more heavily
✓ Adjust for volatility — In low-vol periods, reduce lookback hours to capture only recent flow
Settings Reference
Setting Default Range Purpose
Target Session US UK/US Which market open to analyze
Lookback Hours 4 1-12 Pre-session analysis window
Delta Weight 45 0-100 Importance of volume magnitude
Ratio Weight 35 0-100 Importance of bar consistency
Skew Weight 35 0-100 Importance of spike quality
Ticks Per Row 50 1-500 Footprint granularity
Value Area % 70 50-95 Volume profile threshold
Dashboard Position Bottom Right Top/Bottom Table placement
Skrypt open-source
W zgodzie z duchem TradingView twórca tego skryptu udostępnił go jako open-source, aby użytkownicy mogli przejrzeć i zweryfikować jego działanie. Ukłony dla autora. Korzystanie jest bezpłatne, jednak ponowna publikacja kodu podlega naszym Zasadom serwisu.

Wyłączenie odpowiedzialności
Informacje i publikacje nie stanowią i nie powinny być traktowane jako porady finansowe, inwestycyjne, tradingowe ani jakiekolwiek inne rekomendacje dostarczane lub zatwierdzone przez TradingView. Więcej informacji znajduje się w Warunkach użytkowania.
Skrypt open-source
W zgodzie z duchem TradingView twórca tego skryptu udostępnił go jako open-source, aby użytkownicy mogli przejrzeć i zweryfikować jego działanie. Ukłony dla autora. Korzystanie jest bezpłatne, jednak ponowna publikacja kodu podlega naszym Zasadom serwisu.
Wyłączenie odpowiedzialności
Informacje i publikacje nie stanowią i nie powinny być traktowane jako porady finansowe, inwestycyjne, tradingowe ani jakiekolwiek inne rekomendacje dostarczane lub zatwierdzone przez TradingView. Więcej informacji znajduje się w Warunkach użytkowania.