Chandelier Exit Trend [QuantAlgo]
More exclusive indicators from QuantAlgo
Subscribe to QuantAlgo Essential for $49.99/month to get exclusive indicators by this author. You pay right on TradingView and can use them on your charts straight away.
Explore QuantAlgo Essential🟢 Overview
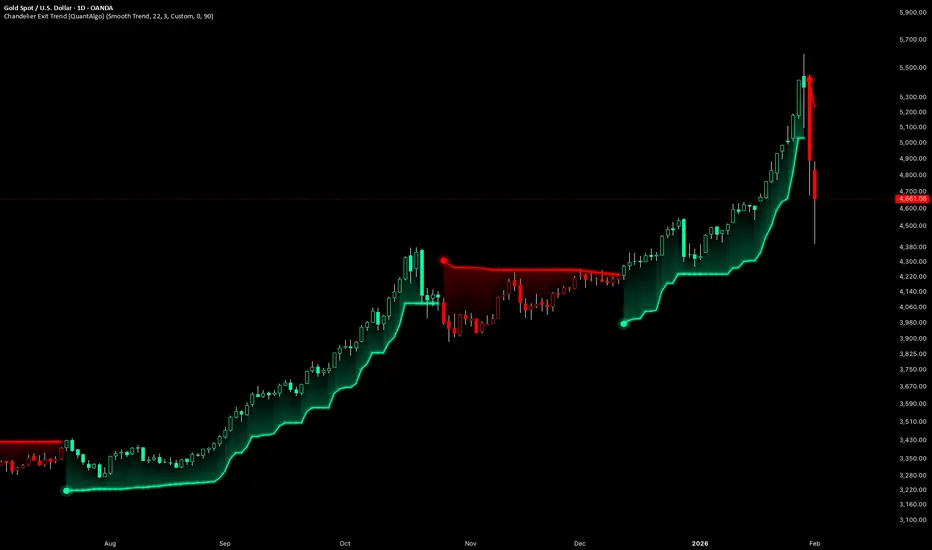
The Chandelier Exit Trend is a trend-following indicator built on a volatility-adjusted trailing stop that resets with every new trend, rather than one measured from a fixed window that can reach back into the previous move. It hangs the stop a multiple of the Average True Range from the trend's highest or lowest price, ratchets it only with the trend as new extremes form or volatility contracts, then confirms a trend change when a bar closes through it, so traders can ride trends against a clearly defined exit level across every timeframe and market.

🟢 How It Works
The indicator is built around the chandelier exit, a trailing stop technique introduced by Chuck LeBeau that hangs the stop from the extreme of a move the way a chandelier hangs from a ceiling, at a distance that widens and narrows with volatility. It has three stages: stop placement from the trend's extreme and the Average True Range, a trailing rule that only lets the stop move in the direction of the trend, and a state engine that confirms trend changes when a bar closes beyond the stop.
First, the stop is placed. The extreme is the highest price seen since the current bullish trend began, or the lowest price seen since the current bearish trend began, looking back no further than the lookback period. Closing prices are used by default and highs and lows when Use Close for Extremes is disabled, while the bar that opens a trend always measures from its close. Because every trend measures from its own extreme, a new trend never hangs its stop from a high or low set before it began, so a fresh stop starts on the correct side of price. The stop then sits the ATR multiple away from that extreme:
Pine Script®
Next, the trailing rule moves the stop. While a bullish trend continues, the long stop takes the higher of its previous value and the newly measured level, so it steps up as new highs form or volatility contracts, and holds its ground through pullbacks and expanding volatility instead of giving back distance. The short stop mirrors this during a bearish trend, stepping only downward. On the first bar of a new trend, the stop starts from the freshly measured level:
Pine Script®
Finally, the state engine confirms trend changes. A bullish trend turns bearish when a bar closes below the previous bar's long stop, and a bearish trend turns bullish when a bar closes above the previous bar's short stop. The confirming bar becomes the first bar of the new trend, which resets the window the next extreme is measured from. States update on confirmed bars, so a confirmed trend change stays in place once the bar closes:
Pine Script®

🟢 Signal Interpretation
▶ Bullish Trend (Rising Stop Below Price with Bullish Color): When a close clears the short stop, a trend change point marks the start of a stop line below price, and the stop line and risk zone take on the bullish color, reading as buyers lifting price through the trailing stop that capped the prior decline. Treat this as a long bias with the stop as its invalidation level: pullbacks that hold above it leave the trend intact, and the bias ends on the first close beneath the long stop, which turns the trend bearish.
▶ Bearish Trend (Falling Stop Above Price with Bearish Color): When a close breaks below the long stop, the trend change point and the stop line appear above price in the bearish color, reading as sellers pressing price beneath the trailing stop that supported the prior advance. Treat this as a short bias with the stop as its invalidation level: bounces that stall below it leave the trend intact, and the bias ends on the first close above the short stop, which turns the trend bullish.

🟢 Features
▶ Preconfigured Presets: Three parameter sets for different trading styles and timeframes. "Default" delivers balanced trend tracking for swing trading on 1H to daily charts, with the lookback period and ATR multiplier adjustable directly. "Fast Response" is built for intraday work on 5 minute to 1H charts, shortening the lookback and hanging the stop closer to the extreme so it trails price more tightly and trend changes confirm sooner. "Smooth Trend" is aimed at position style reading on daily and weekly charts, lengthening the lookback and hanging the stop farther from the extreme so trends hold through deeper pullbacks and change direction less often.

▶ Built-in Alerts: Three alert conditions support hands off monitoring. "Bullish Trend Signal" fires on the bar that confirms a bullish trend by closing above the short stop. "Bearish Trend Signal" fires on the bar that confirms a bearish trend by closing below the long stop. "Any Trend Change" fires on either change. Alert messages include exchange, ticker, and timeframe for immediate context.

▶ Visual Customization: Six color presets (Classic, Aqua, Cosmic, Cyber, Neon, and Custom) apply coordinated bullish and bearish colors to the stop line, stop glow, risk zone, trend change points, optional bar coloring, and optional background coloring. The bullish and bearish color pickers apply when Custom is selected. The glow, zone, trend change points, and both coloring options can each be toggled, with adjustable transparency for the bar and background tints, so the chart stays as clean or as expressive as the workflow requires.

The Chandelier Exit Trend is a trend-following indicator built on a volatility-adjusted trailing stop that resets with every new trend, rather than one measured from a fixed window that can reach back into the previous move. It hangs the stop a multiple of the Average True Range from the trend's highest or lowest price, ratchets it only with the trend as new extremes form or volatility contracts, then confirms a trend change when a bar closes through it, so traders can ride trends against a clearly defined exit level across every timeframe and market.
🟢 How It Works
The indicator is built around the chandelier exit, a trailing stop technique introduced by Chuck LeBeau that hangs the stop from the extreme of a move the way a chandelier hangs from a ceiling, at a distance that widens and narrows with volatility. It has three stages: stop placement from the trend's extreme and the Average True Range, a trailing rule that only lets the stop move in the direction of the trend, and a state engine that confirms trend changes when a bar closes beyond the stop.
First, the stop is placed. The extreme is the highest price seen since the current bullish trend began, or the lowest price seen since the current bearish trend began, looking back no further than the lookback period. Closing prices are used by default and highs and lows when Use Close for Extremes is disabled, while the bar that opens a trend always measures from its close. Because every trend measures from its own extreme, a new trend never hangs its stop from a high or low set before it began, so a fresh stop starts on the correct side of price. The stop then sits the ATR multiple away from that extreme:
Next, the trailing rule moves the stop. While a bullish trend continues, the long stop takes the higher of its previous value and the newly measured level, so it steps up as new highs form or volatility contracts, and holds its ground through pullbacks and expanding volatility instead of giving back distance. The short stop mirrors this during a bearish trend, stepping only downward. On the first bar of a new trend, the stop starts from the freshly measured level:
Finally, the state engine confirms trend changes. A bullish trend turns bearish when a bar closes below the previous bar's long stop, and a bearish trend turns bullish when a bar closes above the previous bar's short stop. The confirming bar becomes the first bar of the new trend, which resets the window the next extreme is measured from. States update on confirmed bars, so a confirmed trend change stays in place once the bar closes:
🟢 Signal Interpretation
▶ Bullish Trend (Rising Stop Below Price with Bullish Color): When a close clears the short stop, a trend change point marks the start of a stop line below price, and the stop line and risk zone take on the bullish color, reading as buyers lifting price through the trailing stop that capped the prior decline. Treat this as a long bias with the stop as its invalidation level: pullbacks that hold above it leave the trend intact, and the bias ends on the first close beneath the long stop, which turns the trend bearish.
▶ Bearish Trend (Falling Stop Above Price with Bearish Color): When a close breaks below the long stop, the trend change point and the stop line appear above price in the bearish color, reading as sellers pressing price beneath the trailing stop that supported the prior advance. Treat this as a short bias with the stop as its invalidation level: bounces that stall below it leave the trend intact, and the bias ends on the first close above the short stop, which turns the trend bullish.
🟢 Features
▶ Preconfigured Presets: Three parameter sets for different trading styles and timeframes. "Default" delivers balanced trend tracking for swing trading on 1H to daily charts, with the lookback period and ATR multiplier adjustable directly. "Fast Response" is built for intraday work on 5 minute to 1H charts, shortening the lookback and hanging the stop closer to the extreme so it trails price more tightly and trend changes confirm sooner. "Smooth Trend" is aimed at position style reading on daily and weekly charts, lengthening the lookback and hanging the stop farther from the extreme so trends hold through deeper pullbacks and change direction less often.
▶ Built-in Alerts: Three alert conditions support hands off monitoring. "Bullish Trend Signal" fires on the bar that confirms a bullish trend by closing above the short stop. "Bearish Trend Signal" fires on the bar that confirms a bearish trend by closing below the long stop. "Any Trend Change" fires on either change. Alert messages include exchange, ticker, and timeframe for immediate context.
▶ Visual Customization: Six color presets (Classic, Aqua, Cosmic, Cyber, Neon, and Custom) apply coordinated bullish and bearish colors to the stop line, stop glow, risk zone, trend change points, optional bar coloring, and optional background coloring. The bullish and bearish color pickers apply when Custom is selected. The glow, zone, trend change points, and both coloring options can each be toggled, with adjustable transparency for the bar and background tints, so the chart stays as clean or as expressive as the workflow requires.

🟢 Access our best trading & investing tools: joinquantalgo.com/plans
🟢 Free Special Edition indicators: joinquantalgo.com/special-editions
🟢 Discord: discord.gg/hJaFyGEAyX
🟢 Free Special Edition indicators: joinquantalgo.com/special-editions
🟢 Discord: discord.gg/hJaFyGEAyX
Wyłączenie odpowiedzialności
Informacje i publikacje nie stanowią i nie powinny być traktowane jako porady finansowe, inwestycyjne, tradingowe ani jakiekolwiek inne rekomendacje dostarczane lub zatwierdzone przez TradingView. Więcej informacji znajduje się w Warunkach użytkowania.
🟢 Access our best trading & investing tools: joinquantalgo.com/plans
🟢 Free Special Edition indicators: joinquantalgo.com/special-editions
🟢 Discord: discord.gg/hJaFyGEAyX
🟢 Free Special Edition indicators: joinquantalgo.com/special-editions
🟢 Discord: discord.gg/hJaFyGEAyX
Wyłączenie odpowiedzialności
Informacje i publikacje nie stanowią i nie powinny być traktowane jako porady finansowe, inwestycyjne, tradingowe ani jakiekolwiek inne rekomendacje dostarczane lub zatwierdzone przez TradingView. Więcej informacji znajduje się w Warunkach użytkowania.