OPEN-SOURCE SCRIPT
Zaktualizowano RSI Dav1zoN
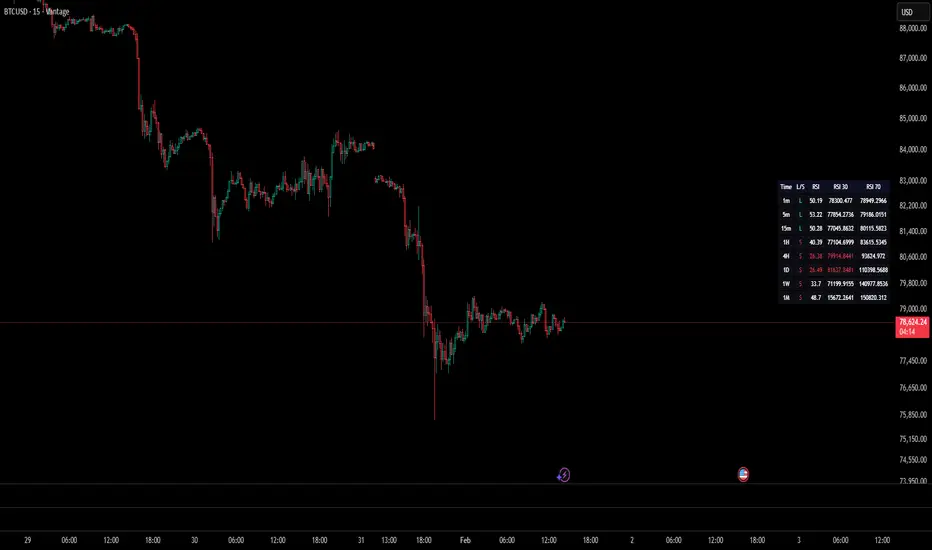
The RSI Grid is a multi-timeframe momentum dashboard designed to give a quick, structured view of market bias across several timeframes at once.
Instead of checking RSI on each timeframe manually, the grid shows direction, RSI value, and projected price levels in one place.
Instead of checking RSI on each timeframe manually, the grid shows direction, RSI value, and projected price levels in one place.
Informacje o Wersji
The RSI Grid is a multi-timeframe momentum dashboard designed to give a quick, structured view of market bias across several timeframes at once.Instead of checking RSI on each timeframe manually, the grid shows direction, RSI value, and projected price levels in one place.
Informacje o Wersji
The RSI Grid is a multi-timeframe momentum dashboard designed to give a quick, structured view of market bias across several timeframes at once.Instead of checking RSI on each timeframe manually, the grid shows direction, RSI value, and projected price levels in one place.
Informacje o Wersji
The RSI Grid is a multi-timeframe momentum dashboard designed to give a quick, structured view of market bias across several timeframes at once.Instead of checking RSI on each timeframe manually, the grid shows direction, RSI value, and projected price levels in one place.
Informacje o Wersji
COLOR UPDATE Informacje o Wersji
UPDATE WITH LONG SHORT AT TIMEFRAME Skrypt open-source
W zgodzie z duchem TradingView twórca tego skryptu udostępnił go jako open-source, aby użytkownicy mogli przejrzeć i zweryfikować jego działanie. Ukłony dla autora. Korzystanie jest bezpłatne, jednak ponowna publikacja kodu podlega naszym Zasadom serwisu.

Wyłączenie odpowiedzialności
Informacje i publikacje nie stanowią i nie powinny być traktowane jako porady finansowe, inwestycyjne, tradingowe ani jakiekolwiek inne rekomendacje dostarczane lub zatwierdzone przez TradingView. Więcej informacji znajduje się w Warunkach użytkowania.
Skrypt open-source
W zgodzie z duchem TradingView twórca tego skryptu udostępnił go jako open-source, aby użytkownicy mogli przejrzeć i zweryfikować jego działanie. Ukłony dla autora. Korzystanie jest bezpłatne, jednak ponowna publikacja kodu podlega naszym Zasadom serwisu.
Wyłączenie odpowiedzialności
Informacje i publikacje nie stanowią i nie powinny być traktowane jako porady finansowe, inwestycyjne, tradingowe ani jakiekolwiek inne rekomendacje dostarczane lub zatwierdzone przez TradingView. Więcej informacji znajduje się w Warunkach użytkowania.