OPEN-SOURCE SCRIPT
Adaptive Keltner Channel [NovaLens]
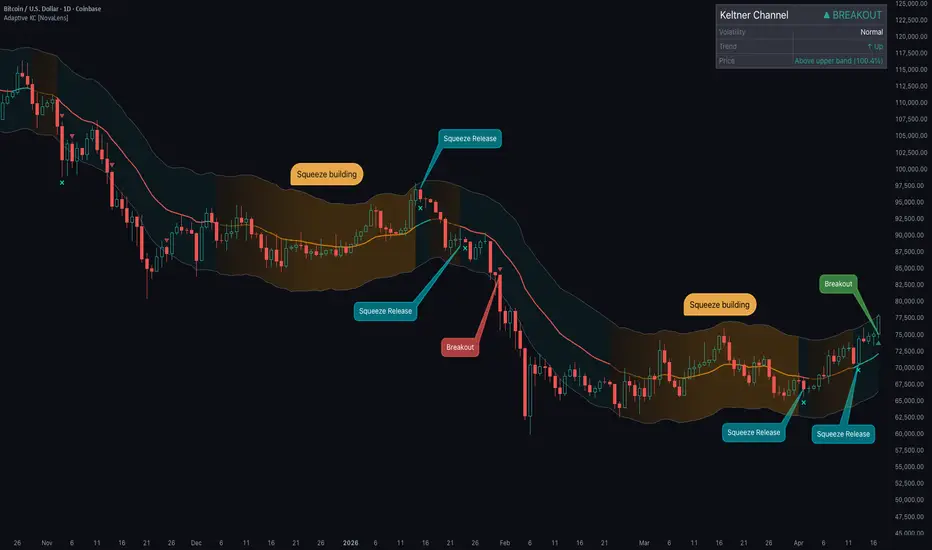
Adaptive Keltner Channel detects when price is doing something exceptional versus simply moving within its expected range. It wraps price in ATR-based bands around an EMA center, optionally adjusts band width to the current volatility regime, and includes built-in squeeze detection and context-aware center reclaim signals.
════════════════════════════════════════════
◉ HOW IT WORKS
The indicator builds on the Keltner Channel concept introduced by Chester Keltner (1960) and refined into the modern ATR-based variant by Linda Bradford Raschke:
In static mode, the multiplier is fixed:
Upper = EMA(Close, Length) + Multiplier x ATR
Lower = EMA(Close, Length) - Multiplier x ATR
In adaptive mode, the multiplier scales with the current ATR percentile rank. When ATR is low relative to recent history, the channel widens to filter routine noise. When ATR is already elevated, the channel tightens so a band break still represents a genuine expansion rather than getting absorbed inside an overly wide envelope.
This is the opposite of how Bollinger Bands behave. Bollinger Bands widen mechanically as volatility rises because they use standard deviation. The adaptive Keltner deliberately tightens its multiplier in high-vol regimes to preserve the usefulness of a breakout signal across different conditions.
The script also includes squeeze detection: when Bollinger Bands contract inside the Keltner Channel, it flags that volatility has compressed. Compressed conditions can precede larger-than-normal moves, though the squeeze does not indicate which direction or guarantee that the expansion will follow through.
════════════════════════════════════════════
◈ HOW TO READ IT
Band interactions:
Center reclaims and losses:
These are not simple center crosses. The indicator tracks which band was touched most recently and only fires a reclaim or loss signal when that context is present. A center cross after sideways consolidation is a different event from a center cross following a failed band extension. This logic filters out a significant amount of the noise that makes naive center-cross signals unreliable.
Squeeze and trend:
The outer bands are intentionally neutral gray. Direction comes from price behavior, center slope, and the interaction signals.
════════════════════════════════════════════
✦ HOW WE USE IT: VOLATILITY CONTEXT
We use this channel as a volatility context layer rather than a standalone signal source. The question it answers: is the current price behavior routine or exceptional for this market's recent history?
When the channel is in squeeze state and the info panel reads "Compressed" with the bar count climbing, that is a low-conviction environment for new directional entries but a high-attention environment for preparation. On BTC 4H with Balanced settings, in our observation squeeze conditions often persist for 8-15 bars while the fill gradually deepens to orange. During that window, we are watching, not acting.
When the squeeze releases and price pushes through a band with the center slope already confirming, that combination (squeeze release, band break, center slope alignment) carries more weight than a random band break during an already-volatile session. No single element alone is the trigger.
On the reversion side, when price flushes to the lower band and then reclaims the center, the state-aware logic recognizes that the last band touched was the lower band. It treats that center cross as a meaningful reclaim rather than noise. This matters because price often consolidates between a band touch and the center for several bars. A naive center-cross indicator would miss the connection. This one remembers.
The practical workflow: use the channel to characterize whether price is inside its expected range, expanding beyond it, or compressed. Layer your directional signals on top of that context.
════════════════════════════════════════════
✦ OTHER APPLICATIONS
════════════════════════════════════════════
⚙ GETTING STARTED
Adaptive Keltner Channel ships with reactivity presets:
Core settings:
Adaptive tuning:
Squeeze settings:
Display:
════════════════════════════════════════════
△ LIMITATIONS
════════════════════════════════════════════
🔔 ALERTS
Six alert conditions are built in so you can monitor without watching the chart:
All alerts fire on bar close by default for confirmed signals.
════════════════════════════════════════════
⌁ NOTES
════════════════════════════════════════════
◉ HOW IT WORKS
The indicator builds on the Keltner Channel concept introduced by Chester Keltner (1960) and refined into the modern ATR-based variant by Linda Bradford Raschke:
- Center line: EMA of close
- Upper band: Center + multiplier x ATR
- Lower band: Center - multiplier x ATR
In static mode, the multiplier is fixed:
Upper = EMA(Close, Length) + Multiplier x ATR
Lower = EMA(Close, Length) - Multiplier x ATR
In adaptive mode, the multiplier scales with the current ATR percentile rank. When ATR is low relative to recent history, the channel widens to filter routine noise. When ATR is already elevated, the channel tightens so a band break still represents a genuine expansion rather than getting absorbed inside an overly wide envelope.
This is the opposite of how Bollinger Bands behave. Bollinger Bands widen mechanically as volatility rises because they use standard deviation. The adaptive Keltner deliberately tightens its multiplier in high-vol regimes to preserve the usefulness of a breakout signal across different conditions.
The script also includes squeeze detection: when Bollinger Bands contract inside the Keltner Channel, it flags that volatility has compressed. Compressed conditions can precede larger-than-normal moves, though the squeeze does not indicate which direction or guarantee that the expansion will follow through.
════════════════════════════════════════════
◈ HOW TO READ IT
Band interactions:
- Price above upper band: upside expansion beyond the recent channel range
- Price below lower band: downside expansion beyond the recent channel range
Center reclaims and losses:
- Price reclaims center after a lower-band touch: downside extension did not hold
- Price loses center after an upper-band touch: upside extension did not hold
These are not simple center crosses. The indicator tracks which band was touched most recently and only fires a reclaim or loss signal when that context is present. A center cross after sideways consolidation is a different event from a center cross following a failed band extension. This logic filters out a significant amount of the noise that makes naive center-cross signals unreliable.
Squeeze and trend:
- Orange fill and center color: squeeze is active, volatility compressed
- Squeeze intensity builds visually as the compression persists
- Green center line: short-term trend pressure is up
- Red center line: short-term trend pressure is down
- Teal X-cross marker below bar: squeeze just released
The outer bands are intentionally neutral gray. Direction comes from price behavior, center slope, and the interaction signals.
════════════════════════════════════════════
✦ HOW WE USE IT: VOLATILITY CONTEXT
We use this channel as a volatility context layer rather than a standalone signal source. The question it answers: is the current price behavior routine or exceptional for this market's recent history?
When the channel is in squeeze state and the info panel reads "Compressed" with the bar count climbing, that is a low-conviction environment for new directional entries but a high-attention environment for preparation. On BTC 4H with Balanced settings, in our observation squeeze conditions often persist for 8-15 bars while the fill gradually deepens to orange. During that window, we are watching, not acting.
When the squeeze releases and price pushes through a band with the center slope already confirming, that combination (squeeze release, band break, center slope alignment) carries more weight than a random band break during an already-volatile session. No single element alone is the trigger.
On the reversion side, when price flushes to the lower band and then reclaims the center, the state-aware logic recognizes that the last band touched was the lower band. It treats that center cross as a meaningful reclaim rather than noise. This matters because price often consolidates between a band touch and the center for several bars. A naive center-cross indicator would miss the connection. This one remembers.
The practical workflow: use the channel to characterize whether price is inside its expected range, expanding beyond it, or compressed. Layer your directional signals on top of that context.
════════════════════════════════════════════
✦ OTHER APPLICATIONS
- Breakout context: band breaks after compression, confirmed by center slope and price acceptance on subsequent bars
- Mean reversion: in sideways conditions, band touches can frame moves back toward the center, especially when the center line is flat rather than sloped
- Trend pullbacks: the center line as a dynamic support/resistance during directional moves
- Risk management: use the center or opposite band as a trailing reference that adapts to current volatility
- Alert-driven workflow: set alerts on squeeze start, squeeze release, breakout up/down, or center reclaim/loss and check the chart only when conditions change
════════════════════════════════════════════
⚙ GETTING STARTED
Adaptive Keltner Channel ships with reactivity presets:
- Reactive: EMA 10 / Mult 1.5 / ATR 10. Tighter bands that respond quickly. Useful when you want the channel to track recent behavior more closely.
- Balanced: EMA 20 / Mult 2.0 / ATR 14. The default. A reasonable starting point for most assets. Start here unless you have a specific reason not to.
- Smooth: EMA 50 / Mult 2.5 / ATR 20. Wider and calmer. Useful on higher timeframes or when you want the channel to only flag larger-scale events.
- Custom: Full manual control for specific setups.
Core settings:
- Reactivity: selects the behavior profile. Start with Balanced.
- Adaptive Band Width: on = regime-aware scaling, off = classic static Keltner. The difference is most visible when the market transitions between calm and volatile periods.
- Adaptive Lookback: how far back ATR is ranked. 100 bars covers roughly 5 months on daily, 4 days on 1H. Increase for assets with long volatility cycles. Decrease for assets that shift regimes quickly.
Adaptive tuning:
- Adaptive Max Multiplier (calm): scales your base multiplier up in quiet conditions. Default 1.25 means the effective multiplier becomes 25% wider than the base (e.g., base 2.0 becomes 2.5). Increase if you are seeing too many false band touches during low-vol periods.
- Adaptive Min Multiplier (vol): scales your base multiplier down in volatile conditions. Default 0.75 means the effective multiplier becomes 25% narrower than the base (e.g., base 2.0 becomes 1.5). Decrease if breakouts are still not clearing the bands during high-vol sessions.
Squeeze settings:
- Show Squeeze Detection: enables Bollinger-inside-Keltner squeeze logic
- BB Length / BB Multiplier: default 20/2.0 matches standard Bollinger. Generally no reason to change unless comparing against a non-standard Bollinger on the same chart.
Display:
- Show Info Panel: 4-row panel showing current state, volatility, trend direction, and price location as a channel percentage. Hover any label for a plain-English explanation.
- Show Squeeze Background: subtle background tint during active squeezes. Off by default.
- Light Theme Mode: adapts panel colors for light backgrounds.
════════════════════════════════════════════
△ LIMITATIONS
- Lagging structure: the center is an EMA and the bands use historical ATR. Sharp reversals can outrun the channel. This is inherent to any channel overlay.
- Squeeze is not directional: a squeeze tells you volatility has contracted, not which way the next move goes. The release can fail, reverse, or stall.
- False band breaks: in noisy conditions, price can poke through a band and return inside on the next bar. Adaptive scaling is designed to help with this, but does not eliminate it.
- Mean-reversion risk in trends: using center reclaims as reversion entries during a strong trend can stay wrong longer than expected. The center keeps moving with the trend.
- History requirement: adaptive scaling needs enough bars to fill the Adaptive Lookback window (default 100 bars) before it adjusts properly. Squeeze detection also needs sufficient Bollinger and Keltner history. Early bars on any chart will have less reliable readings.
════════════════════════════════════════════
🔔 ALERTS
Six alert conditions are built in so you can monitor without watching the chart:
- Breakout Up / Breakout Down: price closes beyond the upper or lower band
- Squeeze Started: Bollinger Bands have contracted inside the Keltner Channel
- Squeeze Released: squeeze just ended, volatility expanding
- Center Reclaim: price crossed above the center after previously touching the lower band
- Center Loss: price crossed below the center after previously touching the upper band
All alerts fire on bar close by default for confirmed signals.
════════════════════════════════════════════
⌁ NOTES
- Original concept by Chester Keltner (1960), modern ATR-based variant by Linda Bradford Raschke
- Uses ATR-based bands with optional volatility-regime adaptation via percentile ranking
- Includes Bollinger-inside-Keltner squeeze detection with visual intensity buildup
- Center reclaim/loss signals use state-aware logic that tracks which band was last touched
- Values update in real time on the current bar and are confirmed at bar close
- Open-source: inspect the logic directly in the Pine editor
Skrypt open-source
W zgodzie z duchem TradingView twórca tego skryptu udostępnił go jako open-source, aby użytkownicy mogli przejrzeć i zweryfikować jego działanie. Ukłony dla autora. Korzystanie jest bezpłatne, jednak ponowna publikacja kodu podlega naszym Zasadom serwisu.

NovaLens builds systematic indicators from real quant research - designed for a cleaner market view.
Wyłączenie odpowiedzialności
Informacje i publikacje nie stanowią i nie powinny być traktowane jako porady finansowe, inwestycyjne, tradingowe ani jakiekolwiek inne rekomendacje dostarczane lub zatwierdzone przez TradingView. Więcej informacji znajduje się w Warunkach użytkowania.
Skrypt open-source
W zgodzie z duchem TradingView twórca tego skryptu udostępnił go jako open-source, aby użytkownicy mogli przejrzeć i zweryfikować jego działanie. Ukłony dla autora. Korzystanie jest bezpłatne, jednak ponowna publikacja kodu podlega naszym Zasadom serwisu.
NovaLens builds systematic indicators from real quant research - designed for a cleaner market view.
Wyłączenie odpowiedzialności
Informacje i publikacje nie stanowią i nie powinny być traktowane jako porady finansowe, inwestycyjne, tradingowe ani jakiekolwiek inne rekomendacje dostarczane lub zatwierdzone przez TradingView. Więcej informacji znajduje się w Warunkach użytkowania.