OPEN-SOURCE SCRIPT
RichmondHillCM - BTC Power Law - Log Price Linear Time
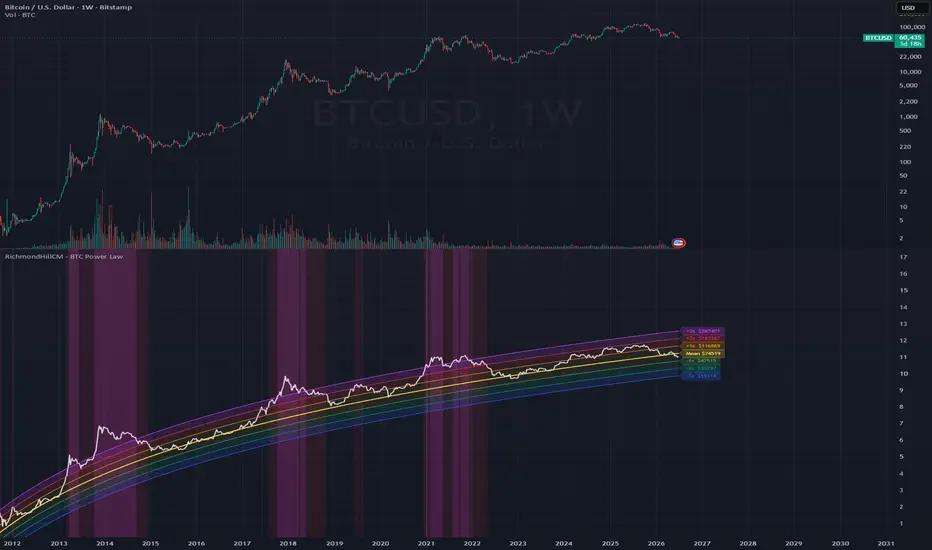
Bitcoin Power Law
The bands are plotted as ln(price) values in a separate pane.
On this pane the power-law mean and all sigma bands appear as
perfectly straight lines, because ln(price) = A*ln(days)+B is
linear in ln(days) -- but we plot against bar_index (linear time)
so the lines curve gently, correctly showing the power-law shape.
HOW TO USE:
1. Add this indicator to BTCUSD (any timeframe, weekly recommended)
2. It opens in its OWN pane below the main chart -- do NOT overlay
3. The pane Y-axis is ln(price) -- read the labels for USD levels
4. No log-scale toggle needed: the pane is already in log-price space
Genesis block: 3 January 2009 00:00 UTC
The bands are plotted as ln(price) values in a separate pane.
On this pane the power-law mean and all sigma bands appear as
perfectly straight lines, because ln(price) = A*ln(days)+B is
linear in ln(days) -- but we plot against bar_index (linear time)
so the lines curve gently, correctly showing the power-law shape.
HOW TO USE:
1. Add this indicator to BTCUSD (any timeframe, weekly recommended)
2. It opens in its OWN pane below the main chart -- do NOT overlay
3. The pane Y-axis is ln(price) -- read the labels for USD levels
4. No log-scale toggle needed: the pane is already in log-price space
Genesis block: 3 January 2009 00:00 UTC
Skrypt open-source
W zgodzie z duchem TradingView twórca tego skryptu udostępnił go jako open-source, aby użytkownicy mogli przejrzeć i zweryfikować jego działanie. Ukłony dla autora. Korzystanie jest bezpłatne, jednak ponowna publikacja kodu podlega naszym Zasadom serwisu.

Wyłączenie odpowiedzialności
Informacje i publikacje nie stanowią i nie powinny być traktowane jako porady finansowe, inwestycyjne, tradingowe ani jakiekolwiek inne rekomendacje dostarczane lub zatwierdzone przez TradingView. Więcej informacji znajduje się w Warunkach użytkowania.
Skrypt open-source
W zgodzie z duchem TradingView twórca tego skryptu udostępnił go jako open-source, aby użytkownicy mogli przejrzeć i zweryfikować jego działanie. Ukłony dla autora. Korzystanie jest bezpłatne, jednak ponowna publikacja kodu podlega naszym Zasadom serwisu.
Wyłączenie odpowiedzialności
Informacje i publikacje nie stanowią i nie powinny być traktowane jako porady finansowe, inwestycyjne, tradingowe ani jakiekolwiek inne rekomendacje dostarczane lub zatwierdzone przez TradingView. Więcej informacji znajduje się w Warunkach użytkowania.