Zaktualizowano
CQ_(7)_[PIXEL TACHIMETER] v2.9
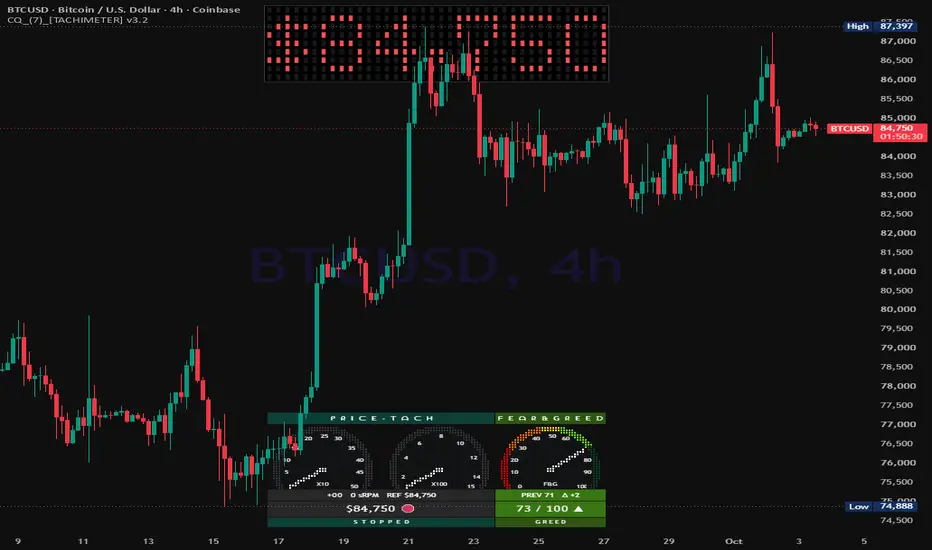
================================================================================
CQ_(7)_[TACHIMETER] v2.9
Description & User Manual
Pine Script v6 indicator for TradingView · © CQuevedo345
================================================================================
--------------------------------------------------------------------------------
1. WHAT IT IS
--------------------------------------------------------------------------------
The Tachimeter is a "speedometer for price". Instead of showing where price
is, it shows how fast price is moving right now, the way a car's tachometer
shows engine RPM.
Every tick, it measures how far price has moved over a short, recent window
(by default the last 10 seconds) and displays that move on a gauge:
- A small move reads near zero and the gauge sits at "IDLING".
- A sharp, fast move pushes the needle up the scale, through the caution
zone and into the redline.
- If price stops changing for a few seconds, the gauge drops back to rest
and reads "STOPPED".
PURPOSE
- Spot bursts of momentum the moment they start (useful for scalping and
short-term entries/exits).
- Tell the difference between a market that is drifting and one that is
accelerating.
- Keep a large, glanceable price display on screen alongside the speed
reading.
The indicator overlays the chart and draws only tables. It does not plot
lines or signals and does not repaint price.
--------------------------------------------------------------------------------
2. HOW THE READING IS CALCULATED
--------------------------------------------------------------------------------
RPM (signed price change)
RPM = current close − close from one Reaction Window ago
The Reaction Window is set in GENERAL (default: 10 seconds). RPM is in
price units: on BTC, an RPM of +412 means price is $412 higher than it was
10 seconds ago.
sRPM (gauge reading)
The gauges show the size of the move, without its sign:
- Auto-Adaptive Sensitivity OFF (default):
sRPM = |RPM| × Sensitivity Multiplier
The scales read directly in price units: a +412 move reads 412.
- Auto-Adaptive Sensitivity ON:
sRPM = (|RPM| ÷ ATR) × 100 × Sensitivity Multiplier
The reading becomes "% of ATR", so the gauge reacts at a similar speed on
any symbol or timeframe. With this on, the reading no longer matches the
dollar move (e.g. +412 with an ATR of ~1,000 reads only ~40).
Direction
▲ = price is up over the window (bullish), ▼ = down (bearish),
🛑 = gauge is STOPPED (reading below 10).
Idle reset
If the price has not changed for "Reset Reading After No Price Change"
seconds (default 5), RPM is forced to 0 in every mode: the bars empty, the
needles drop to rest, and the gauge reads STOPPED. The next price change
restores the live reading instantly.
Acceleration label (shown in every mode)
sRPM below 10 ............ S T O P P E D
10 – 100 ................. I D L I N G
101 – 199 ................ EXTREMELY WEAK
200 – 299 ................ VERY WEAK
300 – 399 ................ WEAK
400 – 499 ................ MOSTLY WEAK
500 – 599 ................ SOMEWHAT WEAK
600 – 699 ................ MODERATELY WEAK
700 – 799 ................ MODERATE
800 – 899 ................ MODERATELY STRONG
900 – 999 ................ MOSTLY STRONG
1000 – 1099 .............. STRONG
1100 – 1199 .............. VERY STRONG
1200 – 1299 .............. EXCEPTIONALLY STRONG
1300 and above ........... ULTRA STRONG
--------------------------------------------------------------------------------
3. GAUGE MODES
--------------------------------------------------------------------------------
Choose the mode in GENERAL > Gauge Mode. Only one gauge is drawn at a time.
3.1 CLASSIC X10/X100 BARS
The original dashboard table (default position: Top Left) with:
- Title row: "P R I C E - T A C H" and the acceleration label.
- Two stacked 13-segment bars:
X10 bar — one block per 10 of sRPM (0–100); fills completely once the
reading passes 101.
X100 bar — one block per 100 of sRPM, from 100 up to 1300. The last
three blocks light in a "hot" color (🟦 bullish / 🟨 bearish).
Scale under the bars: 2 4 6 8 10 11 12 13 (multiply by X10 or X100).
- RPM cell: the signed price change (e.g. +412).
- Price cell: current price plus ▲ / ▼ / 🛑.
- Optional colored accent bar along the bottom.
The Dot Matrix Price table is never drawn in this mode.
3.2 PIXEL DIAL (default)
Two round 240° dials built from table cells, pinned to the screen
(default position: Middle Right):
LEFT dial — X10 — scope 0 to 500
Numbers: 0 5 10 15 20 25 30 35 40 45 50 (× 10)
Caution zone 400–450, redline 450+
RIGHT dial — X100 — scope 100 to 1500
Numbers: 1 2 4 6 8 10 12 14 15 (× 100)
Caution zone 1000–1200, redline 1200+
Both dials follow the same reading, so they move together: when the left
needle reads 41 (412), the right needle reads just past 4 (412). Below 100
the right needle rests at its start ("1").
Scale numbers are printed at 1x; the X10 / X100 caption in the bottom of
each dial is the multiplier.
Arc colors:
- From the start of each dial up to its caution zone, the arc fades from
a dark to a bright bull (green) or bear (red) color.
- Caution zone in orange, redline in fuchsia (all adjustable).
- The lit part of the arc runs up to the live reading.
- A faded "peak trail" shows the highest recent reading and falls back
by the Peak Hold Half-Life.
- The unlit part of the arc is dim gray.
Below the dials (spanning both):
- Title tag above: P R I C E - T A C H
- RPM tag: signed RPM + sRPM (or % ATR)
- Price tag: current price + ▲ / ▼ / 🛑
- Acceleration tag: STOPPED … ULTRA STRONG
The Classic dashboard is turned off in this mode, and the Dot Matrix Price
table (section 4) is turned on automatically (unless you switch it off).
Note: the left dial runs to 500, so it does not peg at 101 the way the
Classic X10 bar does.
--------------------------------------------------------------------------------
4. DOT MATRIX PRICE TABLE
--------------------------------------------------------------------------------
A large LED-panel style display drawn with a 5×7 dot-matrix font
(default position: Top Center). Shown only in Pixel Dial mode, and only when
"Show Price Table" is on.
Display modes:
Price — current close, rounded to whole units, up to 9,999,999.
Time — current clock time (with or without seconds).
Countdown — time remaining until the current bar closes.
The ticker (e.g. BTCUSD) can be printed in front of the price, in the same
dot-matrix font. In Direction color mode the price lights green when the
close is at or above the previous close, red when below.
--------------------------------------------------------------------------------
5. SETTINGS REFERENCE (defaults in brackets)
--------------------------------------------------------------------------------
GENERAL (ALL MODES)
Gauge Mode ............................ Classic X10/X100 Bars / Pixel Dial
[Pixel Dial]
Gauge Square Color Mode ............... Trend Color (green/red) or White
[Trend Color]
Price Font ............................ Font used for the price in the
dashboard and on the dial tags
[Monospace]
Reaction Window Unit .................. Seconds / Minutes [Seconds]
Reaction Window Length ................ How far back the move is measured.
Seconds are capped at 59. [10]
Auto-Adaptive Sensitivity (ATR) ....... See section 2 [OFF]
ATR Length ............................ Used only when adaptive is ON [14]
Sensitivity Multiplier ................ Scales the reading [1.0]
Reset Reading After No Price Change ... Seconds; 0 = never [5]
Stopped Value Cell Background ......... Color of the RPM/price cells and
tags while STOPPED [dark gray]
1 · CLASSIC X10/X100 BARS
Show Current Price and Tachimeter ..... Dashboard on/off [ON]
Dashboard Position .................... [Top Left]
Dashboard Size ........................ Tiny for mobile, Small for web
[Tiny]
Price Cell Font Size .................. [Large]
Show Bottom Accent Bar ................ [ON]
2 · PIXEL DIAL — NEEDLE & ARC
Peak Hold Half-Life (seconds) ......... How fast the peak trail falls back
[3.0]
Needle Color .......................... [White]
Caution Zone Color .................... X10 400–450, X100 1000–1200
[Orange]
Redline Zone Color .................... X10 450+, X100 1200+ [Fuchsia]
Bull Arc Gradient Dark / Bright ....... [dark green / bright green]
Bear Arc Gradient Dark / Bright ....... [dark red / bright red]
2 · PIXEL DIAL
Pixel Dial Position ................... [Middle Right]
Pixel Width (% of chart) .............. [0.15]
Pixel Height (% of chart) ............. [0.3]
Dial Size (×) ......................... Scales width and height together
[1.0]
Scale Number Size ..................... Numbers and X10/X100 captions
[Tiny]
Needle Thickness ...................... 1–10 [4]
Dial Price Size ....................... [Normal]
Dial Title Tag Size ................... [Small]
Dial RPM Tag Size ..................... [Small]
Dial Acceleration Tag Size ............ [Tiny]
Dial Face Color ....................... [black, 35% transparent]
Scale Number Color .................... [Gray]
3 · DOT MATRIX PRICE — Display
Show Price Table ...................... [ON]
Mode .................................. Price / Time / Countdown [Price]
Show Seconds (Time) ................... [ON]
Timezone .............................. Blank = exchange timezone.
Examples: America/Chicago, UTC,
GMT-5 [blank]
3 · DOT MATRIX PRICE — Format
Prefix / Suffix ....................... Text before / after the price
(Price mode only) [$ / blank]
Thousands Separators .................. [ON]
Show Unlit Leading Digits (fixed 7) ... Pads to 7 digits with unlit
digits [OFF]
Glyph Spacing (columns) ............... 0–3 [1]
3 · DOT MATRIX PRICE — Style
Render ................................ Character (draws the dot symbol) or
Cell Background (fills cells)
[Character]
Cell Gap px ........................... Gap between cells; use 1–2 with
Cell Background for a dotted look
[0]
Dot ................................... ● ■ ◆ █ [●]
Size .................................. Auto … Huge [Tiny]
Color Mode ............................ Static (Lit color) or Direction
(Bull / Bear) [Direction]
Lit / Bull / Bear ..................... [green / green / red]
Unlit Dots + color .................... Shows the dark panel dots [ON]
Background / Frame / Frame width ...... [black / dark gray / 1]
3 · DOT MATRIX PRICE — Layout
Position .............................. [Top Center]
Cell W % / Cell H % ................... 0 = auto (fits the dot) [0 / 0]
Ticker Caption ........................ Prints the ticker before the price
[ON]
--------------------------------------------------------------------------------
6. QUICK START
--------------------------------------------------------------------------------
1. Add the indicator to a chart. For the fastest reaction use a 1-second
to 15-second chart (or any chart, if your plan supports second-based
data for the Reaction Window).
2. It opens in Pixel Dial mode with the Dot Matrix Price table on top.
3. If the dials look oval, adjust Pixel Width and Pixel Height (2 · PIXEL
DIAL) until they look round on your screen. Wide monitors need a
smaller width than height.
4. Use Dial Size to make both dials larger or smaller without changing
their shape.
5. Make sure the Pixel Dial, the Dot Matrix table and (in Classic mode)
the dashboard are in different screen positions. Two tables in the same
position draw on top of each other.
6. Tune the reading:
- Gauge too jumpy → raise Reaction Window Length.
- Gauge too slow → lower it.
- Readings too small or too large for the scale → change the
Sensitivity Multiplier.
- Trading many different symbols → consider turning
Auto-Adaptive Sensitivity ON (the scale then reads % of ATR).
--------------------------------------------------------------------------------
7. TIPS & TROUBLESHOOTING
--------------------------------------------------------------------------------
The needles barely move / the reading looks too low
Check GENERAL > Auto-Adaptive Sensitivity. When ON, the gauge reads % of
ATR instead of price units. The RPM tag ends in "% ATR" when it is on and
"sRPM" when it is off.
The gauge never leaves STOPPED or IDLING
The market may be quiet, or the Reaction Window may be too short. Raise
the window length or the Sensitivity Multiplier.
The needles don't drop back to rest the instant price stops
Pine scripts only run when a new tick arrives; there is no timer. The
reset happens on the first tick after the reset time is up. On a market
with no trades at all, the gauge stays where it is until the next tick.
The peak trail doesn't fade on historical bars
Peak decay and the idle reset work in realtime only.
Seconds-based Reaction Window shows nothing
Second-based data requires a TradingView plan that supports it. Switch
Reaction Window Unit to Minutes if needed.
Scale numbers or tags are cut off
Increase Dial Size, or reduce the font sizes in 2 · PIXEL DIAL. Long
acceleration labels (e.g. EXCEPTIONALLY STRONG) are the widest.
A scale number disappears now and then
This is intentional: a number is hidden while the needle passes over it,
so the needle is never covered.
"Script takes too long to execute"
Pixel Dial mode redraws a few thousand table cells every tick (both
dials plus the Dot Matrix table). To lighten the load, turn off Show
Price Table, turn off Unlit Dots, or lower Dial Size.
Settings reset after updating the script
When setting groups are renamed between versions, TradingView may reset
some saved values. Re-check your settings after each update.
--------------------------------------------------------------------------------
8. GLOSSARY
--------------------------------------------------------------------------------
RPM ........... Signed price change over the Reaction Window.
sRPM .......... Gauge reading: size of the move, after sensitivity
(and ATR normalization, if enabled).
Reaction Window The time span the price change is measured over.
X10 / X100 .... Scale multipliers. A "4" on the X100 dial means 400.
Caution zone .. Orange arc section before the redline.
Redline ....... Fuchsia arc section at the top of each scale.
Peak trail .... Faded arc showing the highest recent reading.
Daily open color Header tags are teal when price is above the day's open,
dark red when below.
================================================================================
End of manual
================================================================================================================================================================
CQ_(7)_[TACHIMETER] v2.9
Description & User Manual
Pine Script v6 indicator for TradingView · © CQuevedo345
================================================================================
--------------------------------------------------------------------------------
1. WHAT IT IS
--------------------------------------------------------------------------------
The Tachimeter is a "speedometer for price". Instead of showing where price
is, it shows how fast price is moving right now, the way a car's tachometer
shows engine RPM.
Every tick, it measures how far price has moved over a short, recent window
(by default the last 10 seconds) and displays that move on a gauge:
- A small move reads near zero and the gauge sits at "IDLING".
- A sharp, fast move pushes the needle up the scale, through the caution
zone and into the redline.
- If price stops changing for a few seconds, the gauge drops back to rest
and reads "STOPPED".
PURPOSE
- Spot bursts of momentum the moment they start (useful for scalping and
short-term entries/exits).
- Tell the difference between a market that is drifting and one that is
accelerating.
- Keep a large, glanceable price display on screen alongside the speed
reading.
The indicator overlays the chart and draws only tables. It does not plot
lines or signals and does not repaint price.
--------------------------------------------------------------------------------
2. HOW THE READING IS CALCULATED
--------------------------------------------------------------------------------
RPM (signed price change)
RPM = current close − close from one Reaction Window ago
The Reaction Window is set in GENERAL (default: 10 seconds). RPM is in
price units: on BTC, an RPM of +412 means price is $412 higher than it was
10 seconds ago.
sRPM (gauge reading)
The gauges show the size of the move, without its sign:
- Auto-Adaptive Sensitivity OFF (default):
sRPM = |RPM| × Sensitivity Multiplier
The scales read directly in price units: a +412 move reads 412.
- Auto-Adaptive Sensitivity ON:
sRPM = (|RPM| ÷ ATR) × 100 × Sensitivity Multiplier
The reading becomes "% of ATR", so the gauge reacts at a similar speed on
any symbol or timeframe. With this on, the reading no longer matches the
dollar move (e.g. +412 with an ATR of ~1,000 reads only ~40).
Direction
▲ = price is up over the window (bullish), ▼ = down (bearish),
🛑 = gauge is STOPPED (reading below 10).
Idle reset
If the price has not changed for "Reset Reading After No Price Change"
seconds (default 5), RPM is forced to 0 in every mode: the bars empty, the
needles drop to rest, and the gauge reads STOPPED. The next price change
restores the live reading instantly.
Acceleration label (shown in every mode)
sRPM below 10 ............ S T O P P E D
10 – 100 ................. I D L I N G
101 – 199 ................ EXTREMELY WEAK
200 – 299 ................ VERY WEAK
300 – 399 ................ WEAK
400 – 499 ................ MOSTLY WEAK
500 – 599 ................ SOMEWHAT WEAK
600 – 699 ................ MODERATELY WEAK
700 – 799 ................ MODERATE
800 – 899 ................ MODERATELY STRONG
900 – 999 ................ MOSTLY STRONG
1000 – 1099 .............. STRONG
1100 – 1199 .............. VERY STRONG
1200 – 1299 .............. EXCEPTIONALLY STRONG
1300 and above ........... ULTRA STRONG
--------------------------------------------------------------------------------
3. GAUGE MODES
--------------------------------------------------------------------------------
Choose the mode in GENERAL > Gauge Mode. Only one gauge is drawn at a time.
3.1 CLASSIC X10/X100 BARS
The original dashboard table (default position: Top Left) with:
- Title row: "P R I C E - T A C H" and the acceleration label.
- Two stacked 13-segment bars:
X10 bar — one block per 10 of sRPM (0–100); fills completely once the
reading passes 101.
X100 bar — one block per 100 of sRPM, from 100 up to 1300. The last
three blocks light in a "hot" color (🟦 bullish / 🟨 bearish).
Scale under the bars: 2 4 6 8 10 11 12 13 (multiply by X10 or X100).
- RPM cell: the signed price change (e.g. +412).
- Price cell: current price plus ▲ / ▼ / 🛑.
- Optional colored accent bar along the bottom.
The Dot Matrix Price table is never drawn in this mode.
3.2 PIXEL DIAL (default)
Two round 240° dials built from table cells, pinned to the screen
(default position: Middle Right):
LEFT dial — X10 — scope 0 to 500
Numbers: 0 5 10 15 20 25 30 35 40 45 50 (× 10)
Caution zone 400–450, redline 450+
RIGHT dial — X100 — scope 100 to 1500
Numbers: 1 2 4 6 8 10 12 14 15 (× 100)
Caution zone 1000–1200, redline 1200+
Both dials follow the same reading, so they move together: when the left
needle reads 41 (412), the right needle reads just past 4 (412). Below 100
the right needle rests at its start ("1").
Scale numbers are printed at 1x; the X10 / X100 caption in the bottom of
each dial is the multiplier.
Arc colors:
- From the start of each dial up to its caution zone, the arc fades from
a dark to a bright bull (green) or bear (red) color.
- Caution zone in orange, redline in fuchsia (all adjustable).
- The lit part of the arc runs up to the live reading.
- A faded "peak trail" shows the highest recent reading and falls back
by the Peak Hold Half-Life.
- The unlit part of the arc is dim gray.
Below the dials (spanning both):
- Title tag above: P R I C E - T A C H
- RPM tag: signed RPM + sRPM (or % ATR)
- Price tag: current price + ▲ / ▼ / 🛑
- Acceleration tag: STOPPED … ULTRA STRONG
The Classic dashboard is turned off in this mode, and the Dot Matrix Price
table (section 4) is turned on automatically (unless you switch it off).
Note: the left dial runs to 500, so it does not peg at 101 the way the
Classic X10 bar does.
--------------------------------------------------------------------------------
4. DOT MATRIX PRICE TABLE
--------------------------------------------------------------------------------
A large LED-panel style display drawn with a 5×7 dot-matrix font
(default position: Top Center). Shown only in Pixel Dial mode, and only when
"Show Price Table" is on.
Display modes:
Price — current close, rounded to whole units, up to 9,999,999.
Time — current clock time (with or without seconds).
Countdown — time remaining until the current bar closes.
The ticker (e.g. BTCUSD) can be printed in front of the price, in the same
dot-matrix font. In Direction color mode the price lights green when the
close is at or above the previous close, red when below.
--------------------------------------------------------------------------------
5. SETTINGS REFERENCE (defaults in brackets)
--------------------------------------------------------------------------------
GENERAL (ALL MODES)
Gauge Mode ............................ Classic X10/X100 Bars / Pixel Dial
[Pixel Dial]
Gauge Square Color Mode ............... Trend Color (green/red) or White
[Trend Color]
Price Font ............................ Font used for the price in the
dashboard and on the dial tags
[Monospace]
Reaction Window Unit .................. Seconds / Minutes [Seconds]
Reaction Window Length ................ How far back the move is measured.
Seconds are capped at 59. [10]
Auto-Adaptive Sensitivity (ATR) ....... See section 2 [OFF]
ATR Length ............................ Used only when adaptive is ON [14]
Sensitivity Multiplier ................ Scales the reading [1.0]
Reset Reading After No Price Change ... Seconds; 0 = never [5]
Stopped Value Cell Background ......... Color of the RPM/price cells and
tags while STOPPED [dark gray]
1 · CLASSIC X10/X100 BARS
Show Current Price and Tachimeter ..... Dashboard on/off [ON]
Dashboard Position .................... [Top Left]
Dashboard Size ........................ Tiny for mobile, Small for web
[Tiny]
Price Cell Font Size .................. [Large]
Show Bottom Accent Bar ................ [ON]
2 · PIXEL DIAL — NEEDLE & ARC
Peak Hold Half-Life (seconds) ......... How fast the peak trail falls back
[3.0]
Needle Color .......................... [White]
Caution Zone Color .................... X10 400–450, X100 1000–1200
[Orange]
Redline Zone Color .................... X10 450+, X100 1200+ [Fuchsia]
Bull Arc Gradient Dark / Bright ....... [dark green / bright green]
Bear Arc Gradient Dark / Bright ....... [dark red / bright red]
2 · PIXEL DIAL
Pixel Dial Position ................... [Middle Right]
Pixel Width (% of chart) .............. [0.15]
Pixel Height (% of chart) ............. [0.3]
Dial Size (×) ......................... Scales width and height together
[1.0]
Scale Number Size ..................... Numbers and X10/X100 captions
[Tiny]
Needle Thickness ...................... 1–10 [4]
Dial Price Size ....................... [Normal]
Dial Title Tag Size ................... [Small]
Dial RPM Tag Size ..................... [Small]
Dial Acceleration Tag Size ............ [Tiny]
Dial Face Color ....................... [black, 35% transparent]
Scale Number Color .................... [Gray]
3 · DOT MATRIX PRICE — Display
Show Price Table ...................... [ON]
Mode .................................. Price / Time / Countdown [Price]
Show Seconds (Time) ................... [ON]
Timezone .............................. Blank = exchange timezone.
Examples: America/Chicago, UTC,
GMT-5 [blank]
3 · DOT MATRIX PRICE — Format
Prefix / Suffix ....................... Text before / after the price
(Price mode only) [$ / blank]
Thousands Separators .................. [ON]
Show Unlit Leading Digits (fixed 7) ... Pads to 7 digits with unlit
digits [OFF]
Glyph Spacing (columns) ............... 0–3 [1]
3 · DOT MATRIX PRICE — Style
Render ................................ Character (draws the dot symbol) or
Cell Background (fills cells)
[Character]
Cell Gap px ........................... Gap between cells; use 1–2 with
Cell Background for a dotted look
[0]
Dot ................................... ● ■ ◆ █ [●]
Size .................................. Auto … Huge [Tiny]
Color Mode ............................ Static (Lit color) or Direction
(Bull / Bear) [Direction]
Lit / Bull / Bear ..................... [green / green / red]
Unlit Dots + color .................... Shows the dark panel dots [ON]
Background / Frame / Frame width ...... [black / dark gray / 1]
3 · DOT MATRIX PRICE — Layout
Position .............................. [Top Center]
Cell W % / Cell H % ................... 0 = auto (fits the dot) [0 / 0]
Ticker Caption ........................ Prints the ticker before the price
[ON]
--------------------------------------------------------------------------------
6. QUICK START
--------------------------------------------------------------------------------
1. Add the indicator to a chart. For the fastest reaction use a 1-second
to 15-second chart (or any chart, if your plan supports second-based
data for the Reaction Window).
2. It opens in Pixel Dial mode with the Dot Matrix Price table on top.
3. If the dials look oval, adjust Pixel Width and Pixel Height (2 · PIXEL
DIAL) until they look round on your screen. Wide monitors need a
smaller width than height.
4. Use Dial Size to make both dials larger or smaller without changing
their shape.
5. Make sure the Pixel Dial, the Dot Matrix table and (in Classic mode)
the dashboard are in different screen positions. Two tables in the same
position draw on top of each other.
6. Tune the reading:
- Gauge too jumpy → raise Reaction Window Length.
- Gauge too slow → lower it.
- Readings too small or too large for the scale → change the
Sensitivity Multiplier.
- Trading many different symbols → consider turning
Auto-Adaptive Sensitivity ON (the scale then reads % of ATR).
--------------------------------------------------------------------------------
7. TIPS & TROUBLESHOOTING
--------------------------------------------------------------------------------
The needles barely move / the reading looks too low
Check GENERAL > Auto-Adaptive Sensitivity. When ON, the gauge reads % of
ATR instead of price units. The RPM tag ends in "% ATR" when it is on and
"sRPM" when it is off.
The gauge never leaves STOPPED or IDLING
The market may be quiet, or the Reaction Window may be too short. Raise
the window length or the Sensitivity Multiplier.
The needles don't drop back to rest the instant price stops
Pine scripts only run when a new tick arrives; there is no timer. The
reset happens on the first tick after the reset time is up. On a market
with no trades at all, the gauge stays where it is until the next tick.
The peak trail doesn't fade on historical bars
Peak decay and the idle reset work in realtime only.
Seconds-based Reaction Window shows nothing
Second-based data requires a TradingView plan that supports it. Switch
Reaction Window Unit to Minutes if needed.
Scale numbers or tags are cut off
Increase Dial Size, or reduce the font sizes in 2 · PIXEL DIAL. Long
acceleration labels (e.g. EXCEPTIONALLY STRONG) are the widest.
A scale number disappears now and then
This is intentional: a number is hidden while the needle passes over it,
so the needle is never covered.
"Script takes too long to execute"
Pixel Dial mode redraws a few thousand table cells every tick (both
dials plus the Dot Matrix table). To lighten the load, turn off Show
Price Table, turn off Unlit Dots, or lower Dial Size.
Settings reset after updating the script
When setting groups are renamed between versions, TradingView may reset
some saved values. Re-check your settings after each update.
--------------------------------------------------------------------------------
8. GLOSSARY
--------------------------------------------------------------------------------
RPM ........... Signed price change over the Reaction Window.
sRPM .......... Gauge reading: size of the move, after sensitivity
(and ATR normalization, if enabled).
Reaction Window The time span the price change is measured over.
X10 / X100 .... Scale multipliers. A "4" on the X100 dial means 400.
Caution zone .. Orange arc section before the redline.
Redline ....... Fuchsia arc section at the top of each scale.
Peak trail .... Faded arc showing the highest recent reading.
Daily open color Header tags are teal when price is above the day's open,
dark red when below.
================================================================================
End of manual
================================================================================
CQ_(7)_[TACHIMETER] v2.9
Description & User Manual
Pine Script v6 indicator for TradingView · © CQuevedo345
================================================================================
--------------------------------------------------------------------------------
1. WHAT IT IS
--------------------------------------------------------------------------------
The Tachimeter is a "speedometer for price". Instead of showing where price
is, it shows how fast price is moving right now, the way a car's tachometer
shows engine RPM.
Every tick, it measures how far price has moved over a short, recent window
(by default the last 10 seconds) and displays that move on a gauge:
- A small move reads near zero and the gauge sits at "IDLING".
- A sharp, fast move pushes the needle up the scale, through the caution
zone and into the redline.
- If price stops changing for a few seconds, the gauge drops back to rest
and reads "STOPPED".
PURPOSE
- Spot bursts of momentum the moment they start (useful for scalping and
short-term entries/exits).
- Tell the difference between a market that is drifting and one that is
accelerating.
- Keep a large, glanceable price display on screen alongside the speed
reading.
The indicator overlays the chart and draws only tables. It does not plot
lines or signals and does not repaint price.
--------------------------------------------------------------------------------
2. HOW THE READING IS CALCULATED
--------------------------------------------------------------------------------
RPM (signed price change)
RPM = current close − close from one Reaction Window ago
The Reaction Window is set in GENERAL (default: 10 seconds). RPM is in
price units: on BTC, an RPM of +412 means price is $412 higher than it was
10 seconds ago.
sRPM (gauge reading)
The gauges show the size of the move, without its sign:
- Auto-Adaptive Sensitivity OFF (default):
sRPM = |RPM| × Sensitivity Multiplier
The scales read directly in price units: a +412 move reads 412.
- Auto-Adaptive Sensitivity ON:
sRPM = (|RPM| ÷ ATR) × 100 × Sensitivity Multiplier
The reading becomes "% of ATR", so the gauge reacts at a similar speed on
any symbol or timeframe. With this on, the reading no longer matches the
dollar move (e.g. +412 with an ATR of ~1,000 reads only ~40).
Direction
▲ = price is up over the window (bullish), ▼ = down (bearish),
🛑 = gauge is STOPPED (reading below 10).
Idle reset
If the price has not changed for "Reset Reading After No Price Change"
seconds (default 5), RPM is forced to 0 in every mode: the bars empty, the
needles drop to rest, and the gauge reads STOPPED. The next price change
restores the live reading instantly.
Acceleration label (shown in every mode)
sRPM below 10 ............ S T O P P E D
10 – 100 ................. I D L I N G
101 – 199 ................ EXTREMELY WEAK
200 – 299 ................ VERY WEAK
300 – 399 ................ WEAK
400 – 499 ................ MOSTLY WEAK
500 – 599 ................ SOMEWHAT WEAK
600 – 699 ................ MODERATELY WEAK
700 – 799 ................ MODERATE
800 – 899 ................ MODERATELY STRONG
900 – 999 ................ MOSTLY STRONG
1000 – 1099 .............. STRONG
1100 – 1199 .............. VERY STRONG
1200 – 1299 .............. EXCEPTIONALLY STRONG
1300 and above ........... ULTRA STRONG
--------------------------------------------------------------------------------
3. GAUGE MODES
--------------------------------------------------------------------------------
Choose the mode in GENERAL > Gauge Mode. Only one gauge is drawn at a time.
3.1 CLASSIC X10/X100 BARS
The original dashboard table (default position: Top Left) with:
- Title row: "P R I C E - T A C H" and the acceleration label.
- Two stacked 13-segment bars:
X10 bar — one block per 10 of sRPM (0–100); fills completely once the
reading passes 101.
X100 bar — one block per 100 of sRPM, from 100 up to 1300. The last
three blocks light in a "hot" color (🟦 bullish / 🟨 bearish).
Scale under the bars: 2 4 6 8 10 11 12 13 (multiply by X10 or X100).
- RPM cell: the signed price change (e.g. +412).
- Price cell: current price plus ▲ / ▼ / 🛑.
- Optional colored accent bar along the bottom.
The Dot Matrix Price table is never drawn in this mode.
3.2 PIXEL DIAL (default)
Two round 240° dials built from table cells, pinned to the screen
(default position: Middle Right):
LEFT dial — X10 — scope 0 to 500
Numbers: 0 5 10 15 20 25 30 35 40 45 50 (× 10)
Caution zone 400–450, redline 450+
RIGHT dial — X100 — scope 100 to 1500
Numbers: 1 2 4 6 8 10 12 14 15 (× 100)
Caution zone 1000–1200, redline 1200+
Both dials follow the same reading, so they move together: when the left
needle reads 41 (412), the right needle reads just past 4 (412). Below 100
the right needle rests at its start ("1").
Scale numbers are printed at 1x; the X10 / X100 caption in the bottom of
each dial is the multiplier.
Arc colors:
- From the start of each dial up to its caution zone, the arc fades from
a dark to a bright bull (green) or bear (red) color.
- Caution zone in orange, redline in fuchsia (all adjustable).
- The lit part of the arc runs up to the live reading.
- A faded "peak trail" shows the highest recent reading and falls back
by the Peak Hold Half-Life.
- The unlit part of the arc is dim gray.
Below the dials (spanning both):
- Title tag above: P R I C E - T A C H
- RPM tag: signed RPM + sRPM (or % ATR)
- Price tag: current price + ▲ / ▼ / 🛑
- Acceleration tag: STOPPED … ULTRA STRONG
The Classic dashboard is turned off in this mode, and the Dot Matrix Price
table (section 4) is turned on automatically (unless you switch it off).
Note: the left dial runs to 500, so it does not peg at 101 the way the
Classic X10 bar does.
--------------------------------------------------------------------------------
4. DOT MATRIX PRICE TABLE
--------------------------------------------------------------------------------
A large LED-panel style display drawn with a 5×7 dot-matrix font
(default position: Top Center). Shown only in Pixel Dial mode, and only when
"Show Price Table" is on.
Display modes:
Price — current close, rounded to whole units, up to 9,999,999.
Time — current clock time (with or without seconds).
Countdown — time remaining until the current bar closes.
The ticker (e.g. BTCUSD) can be printed in front of the price, in the same
dot-matrix font. In Direction color mode the price lights green when the
close is at or above the previous close, red when below.
--------------------------------------------------------------------------------
5. SETTINGS REFERENCE (defaults in brackets)
--------------------------------------------------------------------------------
GENERAL (ALL MODES)
Gauge Mode ............................ Classic X10/X100 Bars / Pixel Dial
[Pixel Dial]
Gauge Square Color Mode ............... Trend Color (green/red) or White
[Trend Color]
Price Font ............................ Font used for the price in the
dashboard and on the dial tags
[Monospace]
Reaction Window Unit .................. Seconds / Minutes [Seconds]
Reaction Window Length ................ How far back the move is measured.
Seconds are capped at 59. [10]
Auto-Adaptive Sensitivity (ATR) ....... See section 2 [OFF]
ATR Length ............................ Used only when adaptive is ON [14]
Sensitivity Multiplier ................ Scales the reading [1.0]
Reset Reading After No Price Change ... Seconds; 0 = never [5]
Stopped Value Cell Background ......... Color of the RPM/price cells and
tags while STOPPED [dark gray]
1 · CLASSIC X10/X100 BARS
Show Current Price and Tachimeter ..... Dashboard on/off [ON]
Dashboard Position .................... [Top Left]
Dashboard Size ........................ Tiny for mobile, Small for web
[Tiny]
Price Cell Font Size .................. [Large]
Show Bottom Accent Bar ................ [ON]
2 · PIXEL DIAL — NEEDLE & ARC
Peak Hold Half-Life (seconds) ......... How fast the peak trail falls back
[3.0]
Needle Color .......................... [White]
Caution Zone Color .................... X10 400–450, X100 1000–1200
[Orange]
Redline Zone Color .................... X10 450+, X100 1200+ [Fuchsia]
Bull Arc Gradient Dark / Bright ....... [dark green / bright green]
Bear Arc Gradient Dark / Bright ....... [dark red / bright red]
2 · PIXEL DIAL
Pixel Dial Position ................... [Middle Right]
Pixel Width (% of chart) .............. [0.15]
Pixel Height (% of chart) ............. [0.3]
Dial Size (×) ......................... Scales width and height together
[1.0]
Scale Number Size ..................... Numbers and X10/X100 captions
[Tiny]
Needle Thickness ...................... 1–10 [4]
Dial Price Size ....................... [Normal]
Dial Title Tag Size ................... [Small]
Dial RPM Tag Size ..................... [Small]
Dial Acceleration Tag Size ............ [Tiny]
Dial Face Color ....................... [black, 35% transparent]
Scale Number Color .................... [Gray]
3 · DOT MATRIX PRICE — Display
Show Price Table ...................... [ON]
Mode .................................. Price / Time / Countdown [Price]
Show Seconds (Time) ................... [ON]
Timezone .............................. Blank = exchange timezone.
Examples: America/Chicago, UTC,
GMT-5 [blank]
3 · DOT MATRIX PRICE — Format
Prefix / Suffix ....................... Text before / after the price
(Price mode only) [$ / blank]
Thousands Separators .................. [ON]
Show Unlit Leading Digits (fixed 7) ... Pads to 7 digits with unlit
digits [OFF]
Glyph Spacing (columns) ............... 0–3 [1]
3 · DOT MATRIX PRICE — Style
Render ................................ Character (draws the dot symbol) or
Cell Background (fills cells)
[Character]
Cell Gap px ........................... Gap between cells; use 1–2 with
Cell Background for a dotted look
[0]
Dot ................................... ● ■ ◆ █ [●]
Size .................................. Auto … Huge [Tiny]
Color Mode ............................ Static (Lit color) or Direction
(Bull / Bear) [Direction]
Lit / Bull / Bear ..................... [green / green / red]
Unlit Dots + color .................... Shows the dark panel dots [ON]
Background / Frame / Frame width ...... [black / dark gray / 1]
3 · DOT MATRIX PRICE — Layout
Position .............................. [Top Center]
Cell W % / Cell H % ................... 0 = auto (fits the dot) [0 / 0]
Ticker Caption ........................ Prints the ticker before the price
[ON]
--------------------------------------------------------------------------------
6. QUICK START
--------------------------------------------------------------------------------
1. Add the indicator to a chart. For the fastest reaction use a 1-second
to 15-second chart (or any chart, if your plan supports second-based
data for the Reaction Window).
2. It opens in Pixel Dial mode with the Dot Matrix Price table on top.
3. If the dials look oval, adjust Pixel Width and Pixel Height (2 · PIXEL
DIAL) until they look round on your screen. Wide monitors need a
smaller width than height.
4. Use Dial Size to make both dials larger or smaller without changing
their shape.
5. Make sure the Pixel Dial, the Dot Matrix table and (in Classic mode)
the dashboard are in different screen positions. Two tables in the same
position draw on top of each other.
6. Tune the reading:
- Gauge too jumpy → raise Reaction Window Length.
- Gauge too slow → lower it.
- Readings too small or too large for the scale → change the
Sensitivity Multiplier.
- Trading many different symbols → consider turning
Auto-Adaptive Sensitivity ON (the scale then reads % of ATR).
--------------------------------------------------------------------------------
7. TIPS & TROUBLESHOOTING
--------------------------------------------------------------------------------
The needles barely move / the reading looks too low
Check GENERAL > Auto-Adaptive Sensitivity. When ON, the gauge reads % of
ATR instead of price units. The RPM tag ends in "% ATR" when it is on and
"sRPM" when it is off.
The gauge never leaves STOPPED or IDLING
The market may be quiet, or the Reaction Window may be too short. Raise
the window length or the Sensitivity Multiplier.
The needles don't drop back to rest the instant price stops
Pine scripts only run when a new tick arrives; there is no timer. The
reset happens on the first tick after the reset time is up. On a market
with no trades at all, the gauge stays where it is until the next tick.
The peak trail doesn't fade on historical bars
Peak decay and the idle reset work in realtime only.
Seconds-based Reaction Window shows nothing
Second-based data requires a TradingView plan that supports it. Switch
Reaction Window Unit to Minutes if needed.
Scale numbers or tags are cut off
Increase Dial Size, or reduce the font sizes in 2 · PIXEL DIAL. Long
acceleration labels (e.g. EXCEPTIONALLY STRONG) are the widest.
A scale number disappears now and then
This is intentional: a number is hidden while the needle passes over it,
so the needle is never covered.
"Script takes too long to execute"
Pixel Dial mode redraws a few thousand table cells every tick (both
dials plus the Dot Matrix table). To lighten the load, turn off Show
Price Table, turn off Unlit Dots, or lower Dial Size.
Settings reset after updating the script
When setting groups are renamed between versions, TradingView may reset
some saved values. Re-check your settings after each update.
--------------------------------------------------------------------------------
8. GLOSSARY
--------------------------------------------------------------------------------
RPM ........... Signed price change over the Reaction Window.
sRPM .......... Gauge reading: size of the move, after sensitivity
(and ATR normalization, if enabled).
Reaction Window The time span the price change is measured over.
X10 / X100 .... Scale multipliers. A "4" on the X100 dial means 400.
Caution zone .. Orange arc section before the redline.
Redline ....... Fuchsia arc section at the top of each scale.
Peak trail .... Faded arc showing the highest recent reading.
Daily open color Header tags are teal when price is above the day's open,
dark red when below.
================================================================================
End of manual
================================================================================================================================================================
CQ_(7)_[TACHIMETER] v2.9
Description & User Manual
Pine Script v6 indicator for TradingView · © CQuevedo345
================================================================================
--------------------------------------------------------------------------------
1. WHAT IT IS
--------------------------------------------------------------------------------
The Tachimeter is a "speedometer for price". Instead of showing where price
is, it shows how fast price is moving right now, the way a car's tachometer
shows engine RPM.
Every tick, it measures how far price has moved over a short, recent window
(by default the last 10 seconds) and displays that move on a gauge:
- A small move reads near zero and the gauge sits at "IDLING".
- A sharp, fast move pushes the needle up the scale, through the caution
zone and into the redline.
- If price stops changing for a few seconds, the gauge drops back to rest
and reads "STOPPED".
PURPOSE
- Spot bursts of momentum the moment they start (useful for scalping and
short-term entries/exits).
- Tell the difference between a market that is drifting and one that is
accelerating.
- Keep a large, glanceable price display on screen alongside the speed
reading.
The indicator overlays the chart and draws only tables. It does not plot
lines or signals and does not repaint price.
--------------------------------------------------------------------------------
2. HOW THE READING IS CALCULATED
--------------------------------------------------------------------------------
RPM (signed price change)
RPM = current close − close from one Reaction Window ago
The Reaction Window is set in GENERAL (default: 10 seconds). RPM is in
price units: on BTC, an RPM of +412 means price is $412 higher than it was
10 seconds ago.
sRPM (gauge reading)
The gauges show the size of the move, without its sign:
- Auto-Adaptive Sensitivity OFF (default):
sRPM = |RPM| × Sensitivity Multiplier
The scales read directly in price units: a +412 move reads 412.
- Auto-Adaptive Sensitivity ON:
sRPM = (|RPM| ÷ ATR) × 100 × Sensitivity Multiplier
The reading becomes "% of ATR", so the gauge reacts at a similar speed on
any symbol or timeframe. With this on, the reading no longer matches the
dollar move (e.g. +412 with an ATR of ~1,000 reads only ~40).
Direction
▲ = price is up over the window (bullish), ▼ = down (bearish),
🛑 = gauge is STOPPED (reading below 10).
Idle reset
If the price has not changed for "Reset Reading After No Price Change"
seconds (default 5), RPM is forced to 0 in every mode: the bars empty, the
needles drop to rest, and the gauge reads STOPPED. The next price change
restores the live reading instantly.
Acceleration label (shown in every mode)
sRPM below 10 ............ S T O P P E D
10 – 100 ................. I D L I N G
101 – 199 ................ EXTREMELY WEAK
200 – 299 ................ VERY WEAK
300 – 399 ................ WEAK
400 – 499 ................ MOSTLY WEAK
500 – 599 ................ SOMEWHAT WEAK
600 – 699 ................ MODERATELY WEAK
700 – 799 ................ MODERATE
800 – 899 ................ MODERATELY STRONG
900 – 999 ................ MOSTLY STRONG
1000 – 1099 .............. STRONG
1100 – 1199 .............. VERY STRONG
1200 – 1299 .............. EXCEPTIONALLY STRONG
1300 and above ........... ULTRA STRONG
--------------------------------------------------------------------------------
3. GAUGE MODES
--------------------------------------------------------------------------------
Choose the mode in GENERAL > Gauge Mode. Only one gauge is drawn at a time.
3.1 CLASSIC X10/X100 BARS
The original dashboard table (default position: Top Left) with:
- Title row: "P R I C E - T A C H" and the acceleration label.
- Two stacked 13-segment bars:
X10 bar — one block per 10 of sRPM (0–100); fills completely once the
reading passes 101.
X100 bar — one block per 100 of sRPM, from 100 up to 1300. The last
three blocks light in a "hot" color (🟦 bullish / 🟨 bearish).
Scale under the bars: 2 4 6 8 10 11 12 13 (multiply by X10 or X100).
- RPM cell: the signed price change (e.g. +412).
- Price cell: current price plus ▲ / ▼ / 🛑.
- Optional colored accent bar along the bottom.
The Dot Matrix Price table is never drawn in this mode.
3.2 PIXEL DIAL (default)
Two round 240° dials built from table cells, pinned to the screen
(default position: Middle Right):
LEFT dial — X10 — scope 0 to 500
Numbers: 0 5 10 15 20 25 30 35 40 45 50 (× 10)
Caution zone 400–450, redline 450+
RIGHT dial — X100 — scope 100 to 1500
Numbers: 1 2 4 6 8 10 12 14 15 (× 100)
Caution zone 1000–1200, redline 1200+
Both dials follow the same reading, so they move together: when the left
needle reads 41 (412), the right needle reads just past 4 (412). Below 100
the right needle rests at its start ("1").
Scale numbers are printed at 1x; the X10 / X100 caption in the bottom of
each dial is the multiplier.
Arc colors:
- From the start of each dial up to its caution zone, the arc fades from
a dark to a bright bull (green) or bear (red) color.
- Caution zone in orange, redline in fuchsia (all adjustable).
- The lit part of the arc runs up to the live reading.
- A faded "peak trail" shows the highest recent reading and falls back
by the Peak Hold Half-Life.
- The unlit part of the arc is dim gray.
Below the dials (spanning both):
- Title tag above: P R I C E - T A C H
- RPM tag: signed RPM + sRPM (or % ATR)
- Price tag: current price + ▲ / ▼ / 🛑
- Acceleration tag: STOPPED … ULTRA STRONG
The Classic dashboard is turned off in this mode, and the Dot Matrix Price
table (section 4) is turned on automatically (unless you switch it off).
Note: the left dial runs to 500, so it does not peg at 101 the way the
Classic X10 bar does.
--------------------------------------------------------------------------------
4. DOT MATRIX PRICE TABLE
--------------------------------------------------------------------------------
A large LED-panel style display drawn with a 5×7 dot-matrix font
(default position: Top Center). Shown only in Pixel Dial mode, and only when
"Show Price Table" is on.
Display modes:
Price — current close, rounded to whole units, up to 9,999,999.
Time — current clock time (with or without seconds).
Countdown — time remaining until the current bar closes.
The ticker (e.g. BTCUSD) can be printed in front of the price, in the same
dot-matrix font. In Direction color mode the price lights green when the
close is at or above the previous close, red when below.
--------------------------------------------------------------------------------
5. SETTINGS REFERENCE (defaults in brackets)
--------------------------------------------------------------------------------
GENERAL (ALL MODES)
Gauge Mode ............................ Classic X10/X100 Bars / Pixel Dial
[Pixel Dial]
Gauge Square Color Mode ............... Trend Color (green/red) or White
[Trend Color]
Price Font ............................ Font used for the price in the
dashboard and on the dial tags
[Monospace]
Reaction Window Unit .................. Seconds / Minutes [Seconds]
Reaction Window Length ................ How far back the move is measured.
Seconds are capped at 59. [10]
Auto-Adaptive Sensitivity (ATR) ....... See section 2 [OFF]
ATR Length ............................ Used only when adaptive is ON [14]
Sensitivity Multiplier ................ Scales the reading [1.0]
Reset Reading After No Price Change ... Seconds; 0 = never [5]
Stopped Value Cell Background ......... Color of the RPM/price cells and
tags while STOPPED [dark gray]
1 · CLASSIC X10/X100 BARS
Show Current Price and Tachimeter ..... Dashboard on/off [ON]
Dashboard Position .................... [Top Left]
Dashboard Size ........................ Tiny for mobile, Small for web
[Tiny]
Price Cell Font Size .................. [Large]
Show Bottom Accent Bar ................ [ON]
2 · PIXEL DIAL — NEEDLE & ARC
Peak Hold Half-Life (seconds) ......... How fast the peak trail falls back
[3.0]
Needle Color .......................... [White]
Caution Zone Color .................... X10 400–450, X100 1000–1200
[Orange]
Redline Zone Color .................... X10 450+, X100 1200+ [Fuchsia]
Bull Arc Gradient Dark / Bright ....... [dark green / bright green]
Bear Arc Gradient Dark / Bright ....... [dark red / bright red]
2 · PIXEL DIAL
Pixel Dial Position ................... [Middle Right]
Pixel Width (% of chart) .............. [0.15]
Pixel Height (% of chart) ............. [0.3]
Dial Size (×) ......................... Scales width and height together
[1.0]
Scale Number Size ..................... Numbers and X10/X100 captions
[Tiny]
Needle Thickness ...................... 1–10 [4]
Dial Price Size ....................... [Normal]
Dial Title Tag Size ................... [Small]
Dial RPM Tag Size ..................... [Small]
Dial Acceleration Tag Size ............ [Tiny]
Dial Face Color ....................... [black, 35% transparent]
Scale Number Color .................... [Gray]
3 · DOT MATRIX PRICE — Display
Show Price Table ...................... [ON]
Mode .................................. Price / Time / Countdown [Price]
Show Seconds (Time) ................... [ON]
Timezone .............................. Blank = exchange timezone.
Examples: America/Chicago, UTC,
GMT-5 [blank]
3 · DOT MATRIX PRICE — Format
Prefix / Suffix ....................... Text before / after the price
(Price mode only) [$ / blank]
Thousands Separators .................. [ON]
Show Unlit Leading Digits (fixed 7) ... Pads to 7 digits with unlit
digits [OFF]
Glyph Spacing (columns) ............... 0–3 [1]
3 · DOT MATRIX PRICE — Style
Render ................................ Character (draws the dot symbol) or
Cell Background (fills cells)
[Character]
Cell Gap px ........................... Gap between cells; use 1–2 with
Cell Background for a dotted look
[0]
Dot ................................... ● ■ ◆ █ [●]
Size .................................. Auto … Huge [Tiny]
Color Mode ............................ Static (Lit color) or Direction
(Bull / Bear) [Direction]
Lit / Bull / Bear ..................... [green / green / red]
Unlit Dots + color .................... Shows the dark panel dots [ON]
Background / Frame / Frame width ...... [black / dark gray / 1]
3 · DOT MATRIX PRICE — Layout
Position .............................. [Top Center]
Cell W % / Cell H % ................... 0 = auto (fits the dot) [0 / 0]
Ticker Caption ........................ Prints the ticker before the price
[ON]
--------------------------------------------------------------------------------
6. QUICK START
--------------------------------------------------------------------------------
1. Add the indicator to a chart. For the fastest reaction use a 1-second
to 15-second chart (or any chart, if your plan supports second-based
data for the Reaction Window).
2. It opens in Pixel Dial mode with the Dot Matrix Price table on top.
3. If the dials look oval, adjust Pixel Width and Pixel Height (2 · PIXEL
DIAL) until they look round on your screen. Wide monitors need a
smaller width than height.
4. Use Dial Size to make both dials larger or smaller without changing
their shape.
5. Make sure the Pixel Dial, the Dot Matrix table and (in Classic mode)
the dashboard are in different screen positions. Two tables in the same
position draw on top of each other.
6. Tune the reading:
- Gauge too jumpy → raise Reaction Window Length.
- Gauge too slow → lower it.
- Readings too small or too large for the scale → change the
Sensitivity Multiplier.
- Trading many different symbols → consider turning
Auto-Adaptive Sensitivity ON (the scale then reads % of ATR).
--------------------------------------------------------------------------------
7. TIPS & TROUBLESHOOTING
--------------------------------------------------------------------------------
The needles barely move / the reading looks too low
Check GENERAL > Auto-Adaptive Sensitivity. When ON, the gauge reads % of
ATR instead of price units. The RPM tag ends in "% ATR" when it is on and
"sRPM" when it is off.
The gauge never leaves STOPPED or IDLING
The market may be quiet, or the Reaction Window may be too short. Raise
the window length or the Sensitivity Multiplier.
The needles don't drop back to rest the instant price stops
Pine scripts only run when a new tick arrives; there is no timer. The
reset happens on the first tick after the reset time is up. On a market
with no trades at all, the gauge stays where it is until the next tick.
The peak trail doesn't fade on historical bars
Peak decay and the idle reset work in realtime only.
Seconds-based Reaction Window shows nothing
Second-based data requires a TradingView plan that supports it. Switch
Reaction Window Unit to Minutes if needed.
Scale numbers or tags are cut off
Increase Dial Size, or reduce the font sizes in 2 · PIXEL DIAL. Long
acceleration labels (e.g. EXCEPTIONALLY STRONG) are the widest.
A scale number disappears now and then
This is intentional: a number is hidden while the needle passes over it,
so the needle is never covered.
"Script takes too long to execute"
Pixel Dial mode redraws a few thousand table cells every tick (both
dials plus the Dot Matrix table). To lighten the load, turn off Show
Price Table, turn off Unlit Dots, or lower Dial Size.
Settings reset after updating the script
When setting groups are renamed between versions, TradingView may reset
some saved values. Re-check your settings after each update.
--------------------------------------------------------------------------------
8. GLOSSARY
--------------------------------------------------------------------------------
RPM ........... Signed price change over the Reaction Window.
sRPM .......... Gauge reading: size of the move, after sensitivity
(and ATR normalization, if enabled).
Reaction Window The time span the price change is measured over.
X10 / X100 .... Scale multipliers. A "4" on the X100 dial means 400.
Caution zone .. Orange arc section before the redline.
Redline ....... Fuchsia arc section at the top of each scale.
Peak trail .... Faded arc showing the highest recent reading.
Daily open color Header tags are teal when price is above the day's open,
dark red when below.
================================================================================
End of manual
================================================================================
Informacje o Wersji
Bugs fixed.Informacje o Wersji
Added Fear and Greed GaugeInformacje o Wersji
Added VIX dial.Informacje o Wersji
New features added.
Wyłączenie odpowiedzialności
Informacje i publikacje nie stanowią i nie powinny być traktowane jako porady finansowe, inwestycyjne, tradingowe ani jakiekolwiek inne rekomendacje dostarczane lub zatwierdzone przez TradingView. Więcej informacji znajduje się w Warunkach użytkowania.
Wyłączenie odpowiedzialności
Informacje i publikacje nie stanowią i nie powinny być traktowane jako porady finansowe, inwestycyjne, tradingowe ani jakiekolwiek inne rekomendacje dostarczane lub zatwierdzone przez TradingView. Więcej informacji znajduje się w Warunkach użytkowania.