OPEN-SOURCE SCRIPT
SFI REGIME SHIFT
# Regime Shift
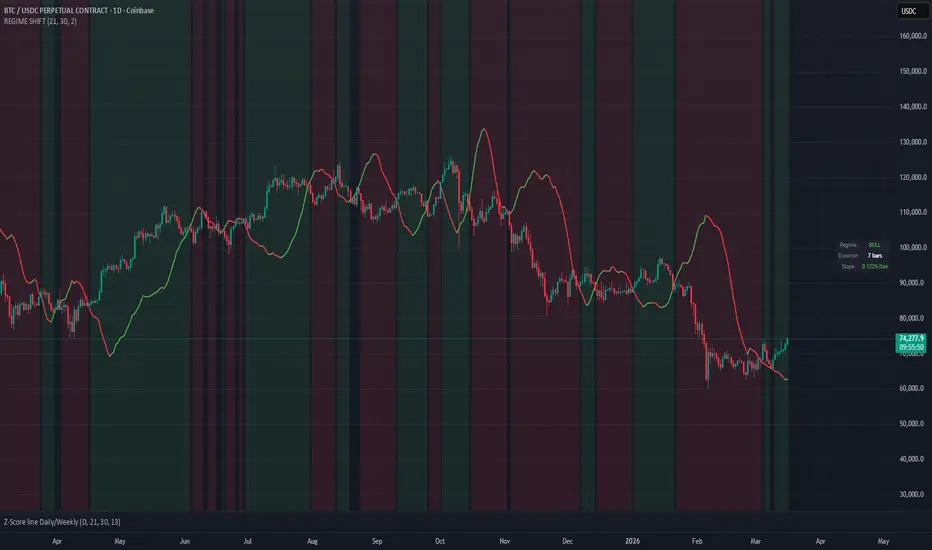
**A projected linear regression overlay that classifies the current market into bull, bear, or flat regimes using n-bar price confirmation, tracks regime duration, and measures trend slope strength — giving you the regime state, how long it's held, and whether it's accelerating or decaying, all in a single compact display.**
---
## What It Does
Regime Shift projects a linear regression line forward by a configurable offset, then checks whether price has held above or below that projection for a minimum number of consecutive bars before committing to a directional label. This avoids the whipsaw problem that plagues raw crossover systems — the indicator won't flip on a single bar spike. The regression line itself is colored by its own slope direction, so you can immediately see whether the underlying trend is strengthening or flattening independent of which side of the line price sits on. A compact dashboard shows the current regime, how many bars it's persisted, and the per-bar slope magnitude.
---
## Theoretical Foundations
- **Forward-projected regression** — The regression line is offset forward from the estimation window, comparing price against where the trend *was heading* rather than where it currently sits, creating a momentum-aware reference instead of a lagging average
- **N-bar confirmation filter** — Regime labels require a configurable number of consecutive bars on one side of the projection before triggering, filtering noise without adding indicator lag
- **Slope as trend quality** — The normalized first difference of the regression line captures whether the trend is accelerating or flattening — a regime can be bullish with a decaying slope, which is a meaningfully different signal than bullish with rising slope
- **Transition-only signaling** — Shift markers fire once on the confirmed bar where a regime change is detected, not on every bar within the regime, keeping the chart clean
---
## Signals
**Bull Regime:**
- Price holds above the projected regression for the required confirmation period → background shades green, dashboard reads BULL
- Rising slope (green regression line) during a bull regime → trend is intact and strengthening
- Flattening or negative slope during a bull regime → price is still above projection but the trend is losing momentum; watch for regime breakdown
**Bear Regime:**
- Price holds below the projected regression for the confirmation period → background shades red, dashboard reads BEAR
- Steepening negative slope during a bear regime → selling pressure is accelerating
- Flattening slope during a bear regime → downtrend is losing conviction
**Flat:**
- Price has not held on either side long enough to meet the confirmation threshold → no background color, dashboard reads FLAT
- Flat regimes are transitions — they tell you the prior regime broke but a new one hasn't been confirmed yet; this is often the most dangerous period for directional bets
**Transition Markers (off by default, toggleable in style tab):**
- Triangle up below bar → bull regime just confirmed
- Triangle down above bar → bear regime just confirmed
- Diamond above bar → regime broke to flat
---
## Dashboard Fields
| Field | Description | Format |
|-------|-------------|--------|
| **Regime** | Current classification: BULL / BEAR / FLAT | Color-coded: green / red / yellow |
| **Duration** | Consecutive bars in the current regime state | Integer + "bars" |
| **Slope** | Per-bar percentage change of the regression line | Signed %, green if positive, red if negative |
---
## Key Inputs
| Input | Default | Guidance |
|-------|---------|----------|
| **Show Regression Line** | On | Toggles the projected regression plot. Turn off if you only want the regime background and dashboard. |
| **Regression Length** | 21 | Lookback window for the least-squares fit. Shorter values (10–15) track faster moves but produce noisier projections. Longer values (30–50) give smoother regimes but lag on reversals. |
| **Regression Offset** | 30 | How many bars forward the regression is projected. Higher offsets create a more demanding reference — price has to move further to stay above/below, which filters more noise but delays detection. Reduce to 10–15 for scalping timeframes. |
| **Confirmation Bars** | 2 | Consecutive bars required on one side of the regression before the regime label commits. 1 = most responsive but more fakeouts. 3–5 = fewer signals, higher conviction per signal. |
| **Show Slope Gradient** | On | When enabled, the regression line color reflects slope direction (green = rising, red = falling) instead of price position relative to the line. |
---
## Data Sources & request.security() Budget
**Total request.security() usage: 0 of 40.** This indicator uses only chart-native price data. No external ticker calls. Compatible with any asset, any timeframe, no budget impact on multi-indicator setups.
---
## Alerts
| Alert | Trigger |
|-------|---------|
| **Regime → Bull** | Fires once when price confirms above the projected regression for the required number of bars |
| **Regime → Bear** | Fires once when price confirms below the projected regression |
| **Regime → Flat** | Fires once when a confirmed regime breaks without the opposite side confirming |
All alerts fire on confirmed bar close only — no intra-bar triggers.
---
## Important Notes
- **Anti-repainting:** All transition signals are gated behind `barstate.isconfirmed`. The regime background updates bar-by-bar based on confirmed close data. No future data is referenced. The regression itself is computed from historical data and projected forward — it does not use future prices.
- **Recommended timeframes:** Works on any timeframe. Default parameters (21-length, 30-offset, 2-bar confirmation) are calibrated for 4H and Daily charts. For 15m–1H, consider reducing the offset to 10–15 and the regression length to 10–15 to match the faster price structure. For Weekly, increase confirmation bars to 3.
- **Asset scope:** Fully asset-agnostic — works on crypto, equities, forex, commodities. No external data dependencies.
- **What it is not:** This is a regime classifier, not a standalone entry signal. It tells you *which environment you're in*, not exactly when to trade. Pair it with entry timing indicators that benefit from knowing the regime context.
**A projected linear regression overlay that classifies the current market into bull, bear, or flat regimes using n-bar price confirmation, tracks regime duration, and measures trend slope strength — giving you the regime state, how long it's held, and whether it's accelerating or decaying, all in a single compact display.**
---
## What It Does
Regime Shift projects a linear regression line forward by a configurable offset, then checks whether price has held above or below that projection for a minimum number of consecutive bars before committing to a directional label. This avoids the whipsaw problem that plagues raw crossover systems — the indicator won't flip on a single bar spike. The regression line itself is colored by its own slope direction, so you can immediately see whether the underlying trend is strengthening or flattening independent of which side of the line price sits on. A compact dashboard shows the current regime, how many bars it's persisted, and the per-bar slope magnitude.
---
## Theoretical Foundations
- **Forward-projected regression** — The regression line is offset forward from the estimation window, comparing price against where the trend *was heading* rather than where it currently sits, creating a momentum-aware reference instead of a lagging average
- **N-bar confirmation filter** — Regime labels require a configurable number of consecutive bars on one side of the projection before triggering, filtering noise without adding indicator lag
- **Slope as trend quality** — The normalized first difference of the regression line captures whether the trend is accelerating or flattening — a regime can be bullish with a decaying slope, which is a meaningfully different signal than bullish with rising slope
- **Transition-only signaling** — Shift markers fire once on the confirmed bar where a regime change is detected, not on every bar within the regime, keeping the chart clean
---
## Signals
**Bull Regime:**
- Price holds above the projected regression for the required confirmation period → background shades green, dashboard reads BULL
- Rising slope (green regression line) during a bull regime → trend is intact and strengthening
- Flattening or negative slope during a bull regime → price is still above projection but the trend is losing momentum; watch for regime breakdown
**Bear Regime:**
- Price holds below the projected regression for the confirmation period → background shades red, dashboard reads BEAR
- Steepening negative slope during a bear regime → selling pressure is accelerating
- Flattening slope during a bear regime → downtrend is losing conviction
**Flat:**
- Price has not held on either side long enough to meet the confirmation threshold → no background color, dashboard reads FLAT
- Flat regimes are transitions — they tell you the prior regime broke but a new one hasn't been confirmed yet; this is often the most dangerous period for directional bets
**Transition Markers (off by default, toggleable in style tab):**
- Triangle up below bar → bull regime just confirmed
- Triangle down above bar → bear regime just confirmed
- Diamond above bar → regime broke to flat
---
## Dashboard Fields
| Field | Description | Format |
|-------|-------------|--------|
| **Regime** | Current classification: BULL / BEAR / FLAT | Color-coded: green / red / yellow |
| **Duration** | Consecutive bars in the current regime state | Integer + "bars" |
| **Slope** | Per-bar percentage change of the regression line | Signed %, green if positive, red if negative |
---
## Key Inputs
| Input | Default | Guidance |
|-------|---------|----------|
| **Show Regression Line** | On | Toggles the projected regression plot. Turn off if you only want the regime background and dashboard. |
| **Regression Length** | 21 | Lookback window for the least-squares fit. Shorter values (10–15) track faster moves but produce noisier projections. Longer values (30–50) give smoother regimes but lag on reversals. |
| **Regression Offset** | 30 | How many bars forward the regression is projected. Higher offsets create a more demanding reference — price has to move further to stay above/below, which filters more noise but delays detection. Reduce to 10–15 for scalping timeframes. |
| **Confirmation Bars** | 2 | Consecutive bars required on one side of the regression before the regime label commits. 1 = most responsive but more fakeouts. 3–5 = fewer signals, higher conviction per signal. |
| **Show Slope Gradient** | On | When enabled, the regression line color reflects slope direction (green = rising, red = falling) instead of price position relative to the line. |
---
## Data Sources & request.security() Budget
**Total request.security() usage: 0 of 40.** This indicator uses only chart-native price data. No external ticker calls. Compatible with any asset, any timeframe, no budget impact on multi-indicator setups.
---
## Alerts
| Alert | Trigger |
|-------|---------|
| **Regime → Bull** | Fires once when price confirms above the projected regression for the required number of bars |
| **Regime → Bear** | Fires once when price confirms below the projected regression |
| **Regime → Flat** | Fires once when a confirmed regime breaks without the opposite side confirming |
All alerts fire on confirmed bar close only — no intra-bar triggers.
---
## Important Notes
- **Anti-repainting:** All transition signals are gated behind `barstate.isconfirmed`. The regime background updates bar-by-bar based on confirmed close data. No future data is referenced. The regression itself is computed from historical data and projected forward — it does not use future prices.
- **Recommended timeframes:** Works on any timeframe. Default parameters (21-length, 30-offset, 2-bar confirmation) are calibrated for 4H and Daily charts. For 15m–1H, consider reducing the offset to 10–15 and the regression length to 10–15 to match the faster price structure. For Weekly, increase confirmation bars to 3.
- **Asset scope:** Fully asset-agnostic — works on crypto, equities, forex, commodities. No external data dependencies.
- **What it is not:** This is a regime classifier, not a standalone entry signal. It tells you *which environment you're in*, not exactly when to trade. Pair it with entry timing indicators that benefit from knowing the regime context.
Skrypt open-source
W zgodzie z duchem TradingView twórca tego skryptu udostępnił go jako open-source, aby użytkownicy mogli przejrzeć i zweryfikować jego działanie. Ukłony dla autora. Korzystanie jest bezpłatne, jednak ponowna publikacja kodu podlega naszym Zasadom serwisu.

Wyłączenie odpowiedzialności
Informacje i publikacje nie stanowią i nie powinny być traktowane jako porady finansowe, inwestycyjne, tradingowe ani jakiekolwiek inne rekomendacje dostarczane lub zatwierdzone przez TradingView. Więcej informacji znajduje się w Warunkach użytkowania.
Skrypt open-source
W zgodzie z duchem TradingView twórca tego skryptu udostępnił go jako open-source, aby użytkownicy mogli przejrzeć i zweryfikować jego działanie. Ukłony dla autora. Korzystanie jest bezpłatne, jednak ponowna publikacja kodu podlega naszym Zasadom serwisu.
Wyłączenie odpowiedzialności
Informacje i publikacje nie stanowią i nie powinny być traktowane jako porady finansowe, inwestycyjne, tradingowe ani jakiekolwiek inne rekomendacje dostarczane lub zatwierdzone przez TradingView. Więcej informacji znajduje się w Warunkach użytkowania.