Trendline Breakout Daily Stats
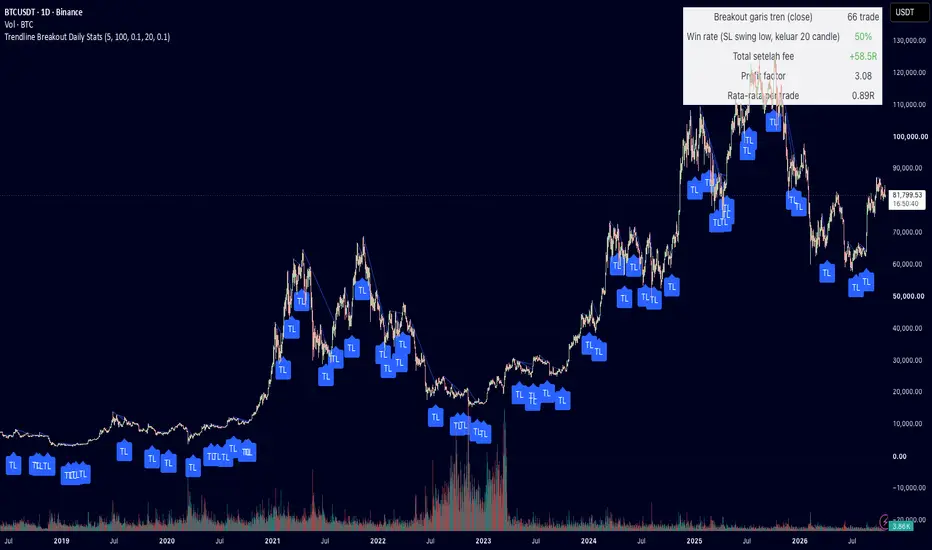
Trendline Breakout Daily Stats draws descending trendlines automatically, marks the first candle that closes above a line, simulates a trade for each breakout, and shows the results in a statistics panel. It was built for the daily timeframe.
Rules (all thresholds are inputs):
- Pivot high: the highest high with 5 candles on each side.
- Trendline: drawn through two consecutive pivot highs where the second is lower than the first; no high between them may exceed the line by more than 0.1%.
- Breakout: the first close above the line, at least 5 candles after the second pivot and within 100 candles of it.
Trade simulation:
- Entry at the next candle open, stop loss at the lowest low since the second pivot, exit at the close of the 20th candle (input) or at the stop. Stop is checked first within a candle.
- Fees of 0.1% per side are deducted in R.
- The panel shows trades, win rate, total R after fees, profit factor and average R per trade for the selected date range.
Notes: a line becomes available only after its second pivot is confirmed (5 candles later), and breakouts are evaluated on closed candles, so signals do not repaint. Historical statistics only; not a trading recommendation.
Rules (all thresholds are inputs):
- Pivot high: the highest high with 5 candles on each side.
- Trendline: drawn through two consecutive pivot highs where the second is lower than the first; no high between them may exceed the line by more than 0.1%.
- Breakout: the first close above the line, at least 5 candles after the second pivot and within 100 candles of it.
Trade simulation:
- Entry at the next candle open, stop loss at the lowest low since the second pivot, exit at the close of the 20th candle (input) or at the stop. Stop is checked first within a candle.
- Fees of 0.1% per side are deducted in R.
- The panel shows trades, win rate, total R after fees, profit factor and average R per trade for the selected date range.
Notes: a line becomes available only after its second pivot is confirmed (5 candles later), and breakouts are evaluated on closed candles, so signals do not repaint. Historical statistics only; not a trading recommendation.

Wyłączenie odpowiedzialności
Informacje i publikacje nie stanowią i nie powinny być traktowane jako porady finansowe, inwestycyjne, tradingowe ani jakiekolwiek inne rekomendacje dostarczane lub zatwierdzone przez TradingView. Więcej informacji znajduje się w Warunkach użytkowania.
Wyłączenie odpowiedzialności
Informacje i publikacje nie stanowią i nie powinny być traktowane jako porady finansowe, inwestycyjne, tradingowe ani jakiekolwiek inne rekomendacje dostarczane lub zatwierdzone przez TradingView. Więcej informacji znajduje się w Warunkach użytkowania.