ATK/DEF Life Swing Maze Labyrinth Wall Structure
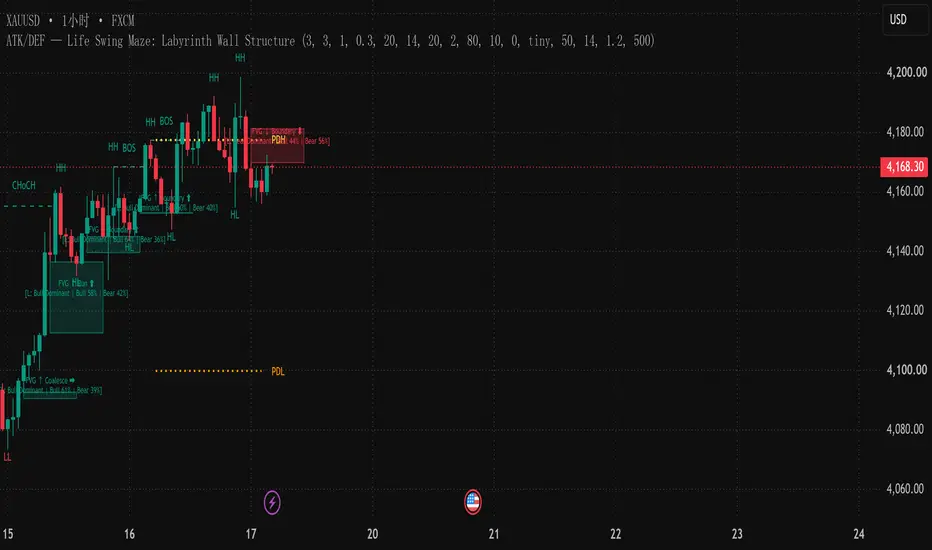
# ATK/DEF — Life Swing Maze: Labyrinth Wall Structure
## Market Structure & Price Behavior Analysis
ATK/DEF — Life Swing Maze: Labyrinth Wall Structure is a multi-layered market analysis indicator that combines swing structure classification, BOS / CHoCH detection, Fair Value Gap (FVG) lifecycle tracking, directional candle-volume distribution, and previous-day price boundaries.
The Labyrinth Wall concept represents the interaction between structural progression, price transitions, imbalance zones, and historical reference levels within a continuously evolving market environment.
## Structural Progression
Swing Highs and Swing Lows form the foundation of the structural framework.
Higher Highs (HH), Higher Lows (HL), Lower Highs (LH), and Lower Lows (LL) describe the progression of confirmed swing points.
Break of Structure (BOS) and Change of Character (CHoCH) identify price interactions with established swing boundaries, highlighting structural continuation and potential transitions in market behavior.
## Fair Value Gap — Imbalance Lifecycle
Bullish and bearish Fair Value Gaps (FVGs) identify price ranges formed by three-candle displacement relationships.
Each active zone is tracked through programmed interaction stages as price revisits, penetrates, or moves beyond its boundaries. These stages represent recorded price interactions rather than predictions of future direction.
## Directional Candle-Volume Distribution
The indicator compares volume associated with bullish and bearish candles within active FVG zones.
The resulting distribution describes relative candle-volume composition and classifies the observed balance as Bull Dominant, Bear Dominant, or Balanced according to the configured threshold.
This calculation represents candle-direction volume distribution, not verified transaction-side order flow.
## Previous-Day Price Boundaries
Previous-Day High (PDH) and Previous-Day Low (PDL) provide historical reference boundaries for examining current price behavior in relation to the previous day's range.
## The Labyrinth Framework
The framework combines four analytical dimensions:
- **Swing Structure:** HH, HL, LH, and LL.
- **Structural Transitions:** BOS and CHoCH.
- **Imbalance Lifecycle:** Bullish and bearish FVG zones with interaction stages.
- **Historical and Volume Context:** PDH, PDL, and directional candle-volume distribution.
Together, these components provide a unified visual representation of structural progression, boundary interactions, imbalance development, and historical price context.
## Chart References
Reference 01:
Reference 02:
Reference 03:
Reference 04:
## Analytical Scope
ATK/DEF — Life Swing Maze: Labyrinth Wall Structure is designed for visual market-structure and price-behavior analysis.
Swing points require confirmation through the configured pivot settings, so their appearance may be delayed relative to the original turning point.
## Market Structure & Price Behavior Analysis
ATK/DEF — Life Swing Maze: Labyrinth Wall Structure is a multi-layered market analysis indicator that combines swing structure classification, BOS / CHoCH detection, Fair Value Gap (FVG) lifecycle tracking, directional candle-volume distribution, and previous-day price boundaries.
The Labyrinth Wall concept represents the interaction between structural progression, price transitions, imbalance zones, and historical reference levels within a continuously evolving market environment.
## Structural Progression
Swing Highs and Swing Lows form the foundation of the structural framework.
Higher Highs (HH), Higher Lows (HL), Lower Highs (LH), and Lower Lows (LL) describe the progression of confirmed swing points.
Break of Structure (BOS) and Change of Character (CHoCH) identify price interactions with established swing boundaries, highlighting structural continuation and potential transitions in market behavior.
## Fair Value Gap — Imbalance Lifecycle
Bullish and bearish Fair Value Gaps (FVGs) identify price ranges formed by three-candle displacement relationships.
Each active zone is tracked through programmed interaction stages as price revisits, penetrates, or moves beyond its boundaries. These stages represent recorded price interactions rather than predictions of future direction.
## Directional Candle-Volume Distribution
The indicator compares volume associated with bullish and bearish candles within active FVG zones.
The resulting distribution describes relative candle-volume composition and classifies the observed balance as Bull Dominant, Bear Dominant, or Balanced according to the configured threshold.
This calculation represents candle-direction volume distribution, not verified transaction-side order flow.
## Previous-Day Price Boundaries
Previous-Day High (PDH) and Previous-Day Low (PDL) provide historical reference boundaries for examining current price behavior in relation to the previous day's range.
## The Labyrinth Framework
The framework combines four analytical dimensions:
- **Swing Structure:** HH, HL, LH, and LL.
- **Structural Transitions:** BOS and CHoCH.
- **Imbalance Lifecycle:** Bullish and bearish FVG zones with interaction stages.
- **Historical and Volume Context:** PDH, PDL, and directional candle-volume distribution.
Together, these components provide a unified visual representation of structural progression, boundary interactions, imbalance development, and historical price context.
## Chart References
Reference 01:
Reference 02:
Reference 03:
Reference 04:
## Analytical Scope
ATK/DEF — Life Swing Maze: Labyrinth Wall Structure is designed for visual market-structure and price-behavior analysis.
Swing points require confirmation through the configured pivot settings, so their appearance may be delayed relative to the original turning point.

Wyłączenie odpowiedzialności
Informacje i publikacje nie stanowią i nie powinny być traktowane jako porady finansowe, inwestycyjne, tradingowe ani jakiekolwiek inne rekomendacje dostarczane lub zatwierdzone przez TradingView. Więcej informacji znajduje się w Warunkach użytkowania.
Wyłączenie odpowiedzialności
Informacje i publikacje nie stanowią i nie powinny być traktowane jako porady finansowe, inwestycyjne, tradingowe ani jakiekolwiek inne rekomendacje dostarczane lub zatwierdzone przez TradingView. Więcej informacji znajduje się w Warunkach użytkowania.