OPEN-SOURCE SCRIPT
WT3D Spread
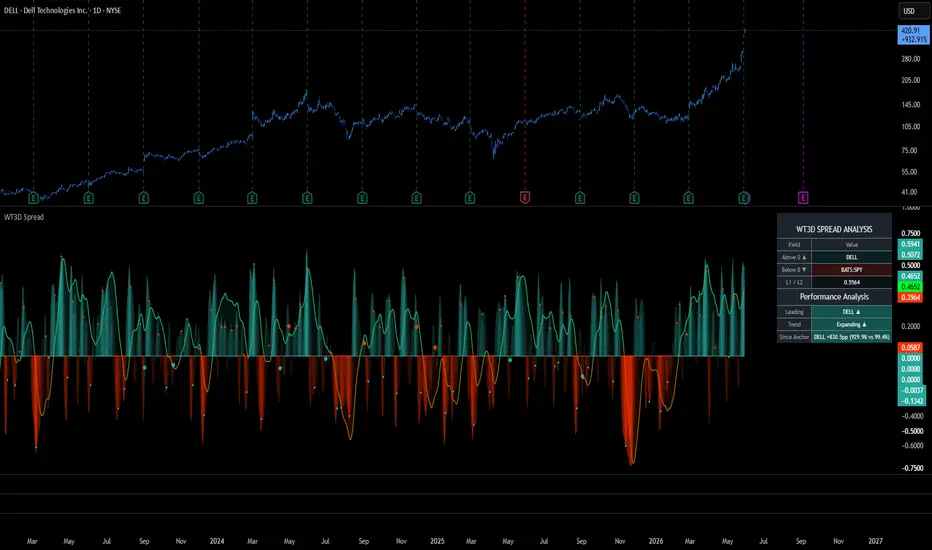
WT3D measures momentum on one asset. WT3D Spread measures relative momentum between two — and that's a different signal entirely. Set any second symbol as your reference; the oscillator runs on the spread between the chart and that reference. NVDA/SPY shows when NVDA is outpacing the market. GDX/GLD shows when miners are leading gold. Altcoin/BTC shows when an alt is decoupling. Same WT3D engine, different question.
Watchlist workflow: leg 1 follows the chart, leg 2 stays pinned. Arrow through your list and watch each name update against your fixed reference in succession.
Built on jdehorty's open-source WaveTrend 3D — full credit chain in the description (jdehorty, LazyBear, PineCoders, veryfid). Additions on top: two-symbol spread layer, anchor-lead tracking from the left visible bar, and an optional currency-debasement view using FRED T10YIFR with calendar-time inflation decay (so the math is right on any chart timeframe, not just daily).
Open-source under MPL 2.0. Feedback welcome.
█ TECHNICAL OVERVIEW
WT3D Spread takes a two-symbol spread — either subtract or ratio — and feeds it into the WaveTrend 3D (WT3D) oscillator engine. WT3D operates on tanh-bounded, quadratic-mean-normalised derivatives, which means the absolute scale of the input is irrelevant; only the rate-of-change shape matters. That property makes spreads a natural fit, because pair-trade dynamics, relative outperformance, and cross-asset divergence are all rate-of-change questions on relative price.
This script is not a re-skin of WT3D. The oscillator core is jdehorty's open-source WaveTrend 3D — credited and linked in full at the bottom — but the surrounding machinery is new and addresses problems the original wasn't built to solve.
█ WHAT THIS SCRIPT ADDS ON TOP OF WT3D
1. Two-symbol spread layer
A second symbol is selectable as an input. The script computes either close1 − close2 (Subtract) or close1 / close2 (Ratio) on the chart's timeframe and routes the resulting series through WT3D's normalisation pipeline as the source. Leg 1 is always the chart symbol and is read directly from `close` rather than through `request.security()` — one fewer security call and no exchange-prefix ambiguity.
Leg 2 is the reference you're measuring against. Common patterns: a broad-market benchmark (SPY, QQQ) for relative-strength against the market; a sector index ETF (XLK for tech, XLE for energy, XLF for financials, GDX for miners, etc.) for sector-relative strength; a single peer ticker for direct pair comparison; or a macro proxy (DXY, GLD, BTC) for currency or hard-asset framing. Because leg 1 follows the chart automatically, you can pin leg 2 to a fixed reference and arrow through a watchlist to rip through comparisons in sequence — each chart change reruns the spread, the oscillator, and the info table against the new chart ticker.
Subtract is the right choice when both legs trade at similar absolute prices (FX crosses, sector ETFs in the same band). Ratio is the right choice when prices differ by an order of magnitude (a $30 stock vs a $500 index ETF, or an altcoin vs BTC), and is also the more honest framing for "outperformance" — d(A/B)/dt carries a B term that doesn't cancel under quadratic-mean normalisation, so the signal genuinely responds to relative dynamics rather than to whichever leg happens to have the larger absolute moves.
2. Currency Mode — calendar-time inflation drag
Optional. When enabled, the info table shows the spread's real (inflation-adjusted) value alongside the nominal value, plus a running purchasing-power drag percentage. Inflation can be pulled live from FRED's T10YIFR series (the bond market's 5-year-5-year forward inflation expectation, used in preference to backward-looking CPI because the indicator is forward-anchored) or set manually for non-USD currencies or scenario testing.
The decay is calendar-time-based, not bar-based: pp_value at any bar equals (1 − inflation)^(years_since_anchor), with years_since_anchor computed from wall-clock timestamps. This matters because the conventional approach of compounding a daily decay factor per bar over-applies the drag on intraday timeframes (six 4H bars × one daily decay each per session) and under-applies it across weekends (no chart bars form while inflation continues). The calendar-time formulation works identically on 1H, daily, or weekly charts and correctly accounts for weekend and holiday gaps.
This adjustment is display-only and does not affect oscillator signals.
3. Anchor Lead tracking
Optional. Locks an anchor bar at the left visible edge on first render and tracks each leg's percentage return from that anchor onward. The info table shows which leg is leading "since anchor," by how many percentage points, and the underlying returns of both legs for context. Useful for separating long-baseline winners from short-term noise — the rolling lead/trend rows above answer "who's winning right now," and the anchor row answers "who's actually won over the period you've been watching."
4. Lead and trend analysis
Always on. Two rows in the info table summarise the current state of the spread: "Leading" identifies which leg is currently outperforming, measured against a 20-bar SMA of the spread and gated by a volatility-aware tie threshold so noise doesn't flip the label. "Trend" answers whether that lead is expanding, holding, or contracting versus five bars ago. Helps interpret the oscillator at a glance.
5. Info table
Theme-aware (auto-detects from the chart background, or force Dark/Light). Shows the two legs colour-tinted to match the bullish/bearish oscillator palette, the live spread value, the lead and trend rows, the optional anchor row, and the optional Currency Mode block.
█ READING THE OSCILLATOR
A bearish reading in this script is not a value judgment. It means Leg 2 is currently outperforming Leg 1 — exactly the same information as "Leg 1 is currently underperforming Leg 2," but the colour convention narrates one of those two readings and silences the other. Whether a red oscillator is good news for you depends entirely on which leg you own, are considering rotating into, or are using as a benchmark.
The green/red colour scheme is inherited from absolute-asset analysis, where in jdehorty's original WT3D red = bad makes perfect sense because there is only one asset and one perspective. On a relative-strength indicator the same colours code "which side is currently winning the spread," not "good versus bad." This is the central conceptual difference between WT3D Spread and the original.
Two pieces of the UI exist to keep this explicit. The "Above 0 ▲" and "Below 0 ▼" rows at the top of the info table show, in live tickers, exactly which symbol the convention maps to for your current pair — so the framing stays visible on every glance and you never have to memorise which colour means what. The "Leading" row further down names the actual winner in plain language regardless of the colour shown. If you want to soften the framing visually, the Use Mirror toggle in Signal Settings renders the chart symmetrically, making both perspectives equally weighted.
█ WHEN TO USE WHICH SPREAD MODE
The default is Ratio because it works universally. Stock divided by SPY, altcoin divided by BTC, a sector ETF divided by a broad-market ETF — all are dimensionless, bounded, and read as relative-strength in the conventional way. The oscillator responds to genuine relative dynamics regardless of how differently the two legs are priced.
Use Subtract instead when both legs trade at similar absolute levels and you specifically want the spread in raw price units. EUR/USD vs GBP/USD, two large-caps in the same band, two sector ETFs around the same price — Subtract gives you a clean dollar (or basis-point) reading. With unequally-priced legs, Subtract is misleading: a 2% move on the cheaper leg is dwarfed by a 0.5% move on the more expensive leg, so the oscillator ends up tracking the dominant leg's volatility rather than the actual relative dynamic.
█ WHAT THIS ISN'T
This is a momentum and divergence tool for spreads, not a statistical-arbitrage toolkit. If your workflow requires cointegration testing, residual half-life estimation, rolling hedge-ratio computation, or stationarity diagnostics, this isn't that. Use it for timing relative-strength shifts and spotting divergences within the WT3D framework, applied to a custom spread you've chosen.
Currency Mode is a display feature for showing real-value erosion against an inflation series. It does not feed back into the oscillator, and it makes the most sense when at least one leg of the spread carries fiat-currency exposure (a USD-denominated commodity, a currency index, a real-asset-vs-fiat pair). On a pure equity-vs-equity spread the Real Value row is technically computable but conceptually thin.
Anchor Lead locks to the left visible bar on first render. If you scroll the chart and want to re-anchor, reload the indicator.
█ CREDITS
Built on jdehorty's open-source WaveTrend 3D (WT3D):
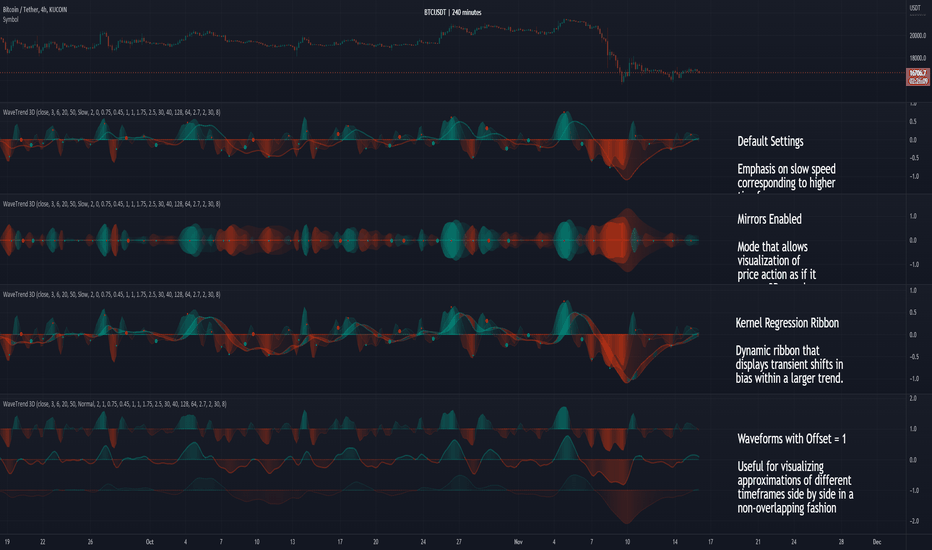
WT3D in turn credits and inherits from:
• LazyBear — original WaveTrend port to Pine (2014)
• PineCoders — colour-gradient framework (the getColorGradientFromSource / getColorGradientFromSteps helpers used throughout)
• veryfid — mirrored-signal cycle analysis and multi-lookback timeframe proxies (the Use Mirror toggle and the Fast/Normal/Slow oscillator structure)
The KernelFunctions library used for the optional kernel overlays is also jdehorty's, imported by reference.
Released under the Mozilla Public License 2.0 — the TradingView default for open-source Pine publications.
█ DISCLAIMER
For analytical and educational use. Past behaviour of any spread, oscillator, or signal carries no guarantee about future behaviour. Do your own due diligence.
Watchlist workflow: leg 1 follows the chart, leg 2 stays pinned. Arrow through your list and watch each name update against your fixed reference in succession.
Built on jdehorty's open-source WaveTrend 3D — full credit chain in the description (jdehorty, LazyBear, PineCoders, veryfid). Additions on top: two-symbol spread layer, anchor-lead tracking from the left visible bar, and an optional currency-debasement view using FRED T10YIFR with calendar-time inflation decay (so the math is right on any chart timeframe, not just daily).
Open-source under MPL 2.0. Feedback welcome.
█ TECHNICAL OVERVIEW
WT3D Spread takes a two-symbol spread — either subtract or ratio — and feeds it into the WaveTrend 3D (WT3D) oscillator engine. WT3D operates on tanh-bounded, quadratic-mean-normalised derivatives, which means the absolute scale of the input is irrelevant; only the rate-of-change shape matters. That property makes spreads a natural fit, because pair-trade dynamics, relative outperformance, and cross-asset divergence are all rate-of-change questions on relative price.
This script is not a re-skin of WT3D. The oscillator core is jdehorty's open-source WaveTrend 3D — credited and linked in full at the bottom — but the surrounding machinery is new and addresses problems the original wasn't built to solve.
█ WHAT THIS SCRIPT ADDS ON TOP OF WT3D
1. Two-symbol spread layer
A second symbol is selectable as an input. The script computes either close1 − close2 (Subtract) or close1 / close2 (Ratio) on the chart's timeframe and routes the resulting series through WT3D's normalisation pipeline as the source. Leg 1 is always the chart symbol and is read directly from `close` rather than through `request.security()` — one fewer security call and no exchange-prefix ambiguity.
Leg 2 is the reference you're measuring against. Common patterns: a broad-market benchmark (SPY, QQQ) for relative-strength against the market; a sector index ETF (XLK for tech, XLE for energy, XLF for financials, GDX for miners, etc.) for sector-relative strength; a single peer ticker for direct pair comparison; or a macro proxy (DXY, GLD, BTC) for currency or hard-asset framing. Because leg 1 follows the chart automatically, you can pin leg 2 to a fixed reference and arrow through a watchlist to rip through comparisons in sequence — each chart change reruns the spread, the oscillator, and the info table against the new chart ticker.
Subtract is the right choice when both legs trade at similar absolute prices (FX crosses, sector ETFs in the same band). Ratio is the right choice when prices differ by an order of magnitude (a $30 stock vs a $500 index ETF, or an altcoin vs BTC), and is also the more honest framing for "outperformance" — d(A/B)/dt carries a B term that doesn't cancel under quadratic-mean normalisation, so the signal genuinely responds to relative dynamics rather than to whichever leg happens to have the larger absolute moves.
2. Currency Mode — calendar-time inflation drag
Optional. When enabled, the info table shows the spread's real (inflation-adjusted) value alongside the nominal value, plus a running purchasing-power drag percentage. Inflation can be pulled live from FRED's T10YIFR series (the bond market's 5-year-5-year forward inflation expectation, used in preference to backward-looking CPI because the indicator is forward-anchored) or set manually for non-USD currencies or scenario testing.
The decay is calendar-time-based, not bar-based: pp_value at any bar equals (1 − inflation)^(years_since_anchor), with years_since_anchor computed from wall-clock timestamps. This matters because the conventional approach of compounding a daily decay factor per bar over-applies the drag on intraday timeframes (six 4H bars × one daily decay each per session) and under-applies it across weekends (no chart bars form while inflation continues). The calendar-time formulation works identically on 1H, daily, or weekly charts and correctly accounts for weekend and holiday gaps.
This adjustment is display-only and does not affect oscillator signals.
3. Anchor Lead tracking
Optional. Locks an anchor bar at the left visible edge on first render and tracks each leg's percentage return from that anchor onward. The info table shows which leg is leading "since anchor," by how many percentage points, and the underlying returns of both legs for context. Useful for separating long-baseline winners from short-term noise — the rolling lead/trend rows above answer "who's winning right now," and the anchor row answers "who's actually won over the period you've been watching."
4. Lead and trend analysis
Always on. Two rows in the info table summarise the current state of the spread: "Leading" identifies which leg is currently outperforming, measured against a 20-bar SMA of the spread and gated by a volatility-aware tie threshold so noise doesn't flip the label. "Trend" answers whether that lead is expanding, holding, or contracting versus five bars ago. Helps interpret the oscillator at a glance.
5. Info table
Theme-aware (auto-detects from the chart background, or force Dark/Light). Shows the two legs colour-tinted to match the bullish/bearish oscillator palette, the live spread value, the lead and trend rows, the optional anchor row, and the optional Currency Mode block.
█ READING THE OSCILLATOR
A bearish reading in this script is not a value judgment. It means Leg 2 is currently outperforming Leg 1 — exactly the same information as "Leg 1 is currently underperforming Leg 2," but the colour convention narrates one of those two readings and silences the other. Whether a red oscillator is good news for you depends entirely on which leg you own, are considering rotating into, or are using as a benchmark.
The green/red colour scheme is inherited from absolute-asset analysis, where in jdehorty's original WT3D red = bad makes perfect sense because there is only one asset and one perspective. On a relative-strength indicator the same colours code "which side is currently winning the spread," not "good versus bad." This is the central conceptual difference between WT3D Spread and the original.
Two pieces of the UI exist to keep this explicit. The "Above 0 ▲" and "Below 0 ▼" rows at the top of the info table show, in live tickers, exactly which symbol the convention maps to for your current pair — so the framing stays visible on every glance and you never have to memorise which colour means what. The "Leading" row further down names the actual winner in plain language regardless of the colour shown. If you want to soften the framing visually, the Use Mirror toggle in Signal Settings renders the chart symmetrically, making both perspectives equally weighted.
█ WHEN TO USE WHICH SPREAD MODE
The default is Ratio because it works universally. Stock divided by SPY, altcoin divided by BTC, a sector ETF divided by a broad-market ETF — all are dimensionless, bounded, and read as relative-strength in the conventional way. The oscillator responds to genuine relative dynamics regardless of how differently the two legs are priced.
Use Subtract instead when both legs trade at similar absolute levels and you specifically want the spread in raw price units. EUR/USD vs GBP/USD, two large-caps in the same band, two sector ETFs around the same price — Subtract gives you a clean dollar (or basis-point) reading. With unequally-priced legs, Subtract is misleading: a 2% move on the cheaper leg is dwarfed by a 0.5% move on the more expensive leg, so the oscillator ends up tracking the dominant leg's volatility rather than the actual relative dynamic.
█ WHAT THIS ISN'T
This is a momentum and divergence tool for spreads, not a statistical-arbitrage toolkit. If your workflow requires cointegration testing, residual half-life estimation, rolling hedge-ratio computation, or stationarity diagnostics, this isn't that. Use it for timing relative-strength shifts and spotting divergences within the WT3D framework, applied to a custom spread you've chosen.
Currency Mode is a display feature for showing real-value erosion against an inflation series. It does not feed back into the oscillator, and it makes the most sense when at least one leg of the spread carries fiat-currency exposure (a USD-denominated commodity, a currency index, a real-asset-vs-fiat pair). On a pure equity-vs-equity spread the Real Value row is technically computable but conceptually thin.
Anchor Lead locks to the left visible bar on first render. If you scroll the chart and want to re-anchor, reload the indicator.
█ CREDITS
Built on jdehorty's open-source WaveTrend 3D (WT3D):
WT3D in turn credits and inherits from:
• LazyBear — original WaveTrend port to Pine (2014)
• PineCoders — colour-gradient framework (the getColorGradientFromSource / getColorGradientFromSteps helpers used throughout)
• veryfid — mirrored-signal cycle analysis and multi-lookback timeframe proxies (the Use Mirror toggle and the Fast/Normal/Slow oscillator structure)
The KernelFunctions library used for the optional kernel overlays is also jdehorty's, imported by reference.
Released under the Mozilla Public License 2.0 — the TradingView default for open-source Pine publications.
█ DISCLAIMER
For analytical and educational use. Past behaviour of any spread, oscillator, or signal carries no guarantee about future behaviour. Do your own due diligence.
Skrypt open-source
W zgodzie z duchem TradingView twórca tego skryptu udostępnił go jako open-source, aby użytkownicy mogli przejrzeć i zweryfikować jego działanie. Ukłony dla autora. Korzystanie jest bezpłatne, jednak ponowna publikacja kodu podlega naszym Zasadom serwisu.

Wyłączenie odpowiedzialności
Informacje i publikacje nie stanowią i nie powinny być traktowane jako porady finansowe, inwestycyjne, tradingowe ani jakiekolwiek inne rekomendacje dostarczane lub zatwierdzone przez TradingView. Więcej informacji znajduje się w Warunkach użytkowania.
Skrypt open-source
W zgodzie z duchem TradingView twórca tego skryptu udostępnił go jako open-source, aby użytkownicy mogli przejrzeć i zweryfikować jego działanie. Ukłony dla autora. Korzystanie jest bezpłatne, jednak ponowna publikacja kodu podlega naszym Zasadom serwisu.
Wyłączenie odpowiedzialności
Informacje i publikacje nie stanowią i nie powinny być traktowane jako porady finansowe, inwestycyjne, tradingowe ani jakiekolwiek inne rekomendacje dostarczane lub zatwierdzone przez TradingView. Więcej informacji znajduje się w Warunkach użytkowania.