Composite Regime Oscillator v6 - Clean Confirmed Reversal
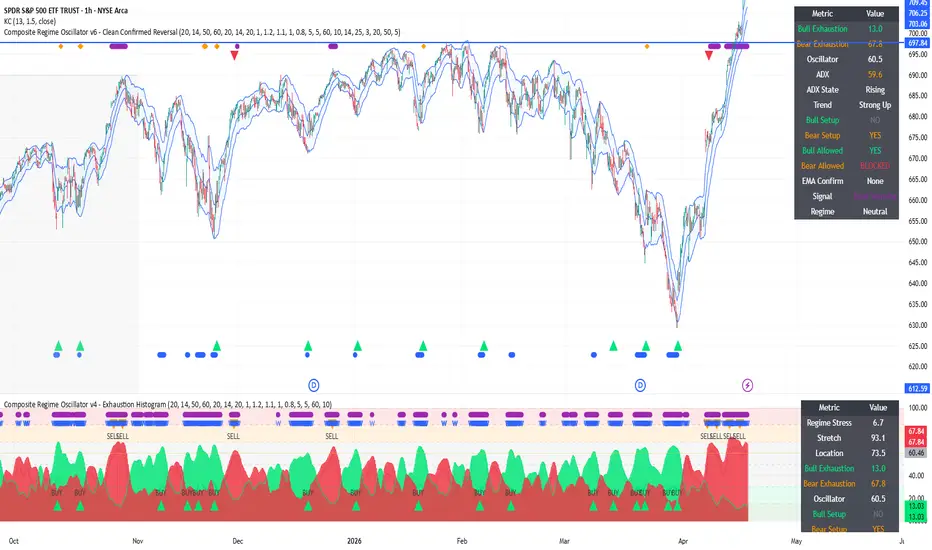
Composite Regime Oscillator v6 – Clean Exhaustion Histogram
Overview
This indicator detects **trend exhaustion** and highlights potential **reversal zones** using a multi-factor model.
Instead of relying on a single condition (like RSI), it combines:
* volatility expansion
* price stretch from equilibrium
* range positioning
* momentum extremes
* volume / pressure
The goal is simple:
> identify when a move becomes unstable and more likely to **reverse or pull back**
---
What makes this indicator different
Most oscillators fail in strong trends — they call tops and bottoms too early.
This script solves that using:
Setup + Trigger + Filter logic
* **Setup** → market is stretched / exhausted
* **Trigger** → price or momentum starts to turn
* **Filter** → strong trends are filtered (ADX + trend structure)
This prevents constant false signals during strong moves.
---
Visual Signals (Clean System)
All signals are shape-based (no text clutter):
* ▲ Green triangle → confirmed bullish reversal
* ▼ Red triangle → confirmed bearish reversal
* ● Blue circle → bullish warning (early exhaustion)
* ● Purple circle → bearish warning (early exhaustion)
* ◆ Orange diamond → trend exhaustion / momentum cooling
---
What the histogram shows
Green histogram (Bullish Exhaustion)
* downside pressure weakening
* panic / oversold conditions
* potential bottoming phase
Red histogram (Bearish Exhaustion)
* upside pressure weakening
* overbought / euphoric conditions
* potential topping phase
Oscillator line
* low → washed out
* mid → neutral
* high → strong momentum / overheating
---
How to use it
---
1. Confirmed Reversal Mode (ADX ON)
Best for:
* swing trading
* cleaner entries
* avoiding fake signals in strong trends
Signals appear only when:
* exhaustion is present
* reversal trigger appears
* trend starts weakening
👉 Interpretation:
**Not just stretched — trend is actually breaking**
2. Aggressive / Scalping Mode (ADX OFF)
Best for:
* scalping
* intraday trading
* early entries
* quick pullbacks
Signals appear earlier because:
* no trend filter
* no ADX restriction
👉 Interpretation:
**Market is stretched and likely to react (not always fully reverse)**
---
Practical usage
Clean chart (recommended)
* Confirmed Signals = ON
* Warnings = OFF
* Exhaustion Markers = OFF
→ Only triangles → clean and focused
---
Full context mode
* Confirmed Signals = ON
* Warnings = ON
* Exhaustion Markers = ON
→ See full market condition
---
How to read the market
Strong trend
* many warning circles
* few confirmed signals
→ trend still healthy
---
Weakening trend
* orange diamonds appear
* warnings reduce
* then triangle appears
→ higher probability reversal
---
Works best in
* extended trends
* volatility expansions
* emotional market phases
---
Works worse in
* tight ranges
* low volatility chop
* slow grinding trends
---
Best used with
* support / resistance
* liquidity zones
* Keltner / Bollinger bands
* RSI divergence
* market structure breaks
* higher timeframe bias
---
Summary
This indicator answers one question:
> **Is the trend still strong — or starting to break?**
* Triangles → confirmed reversals
* Circles → early warnings
* Diamonds → momentum fading
With ADX:
→ cleaner, slower, more reliable
Without ADX:
→ faster, noisier, more aggressive
Final note
This is **not a trend-following indicator**.
It is designed for:
* exhaustion detection
* reversal timing
* identifying unstable price moves
Use it with context — not in isolation.
Overview
This indicator detects **trend exhaustion** and highlights potential **reversal zones** using a multi-factor model.
Instead of relying on a single condition (like RSI), it combines:
* volatility expansion
* price stretch from equilibrium
* range positioning
* momentum extremes
* volume / pressure
The goal is simple:
> identify when a move becomes unstable and more likely to **reverse or pull back**
---
What makes this indicator different
Most oscillators fail in strong trends — they call tops and bottoms too early.
This script solves that using:
Setup + Trigger + Filter logic
* **Setup** → market is stretched / exhausted
* **Trigger** → price or momentum starts to turn
* **Filter** → strong trends are filtered (ADX + trend structure)
This prevents constant false signals during strong moves.
---
Visual Signals (Clean System)
All signals are shape-based (no text clutter):
* ▲ Green triangle → confirmed bullish reversal
* ▼ Red triangle → confirmed bearish reversal
* ● Blue circle → bullish warning (early exhaustion)
* ● Purple circle → bearish warning (early exhaustion)
* ◆ Orange diamond → trend exhaustion / momentum cooling
---
What the histogram shows
Green histogram (Bullish Exhaustion)
* downside pressure weakening
* panic / oversold conditions
* potential bottoming phase
Red histogram (Bearish Exhaustion)
* upside pressure weakening
* overbought / euphoric conditions
* potential topping phase
Oscillator line
* low → washed out
* mid → neutral
* high → strong momentum / overheating
---
How to use it
---
1. Confirmed Reversal Mode (ADX ON)
Best for:
* swing trading
* cleaner entries
* avoiding fake signals in strong trends
Signals appear only when:
* exhaustion is present
* reversal trigger appears
* trend starts weakening
👉 Interpretation:
**Not just stretched — trend is actually breaking**
2. Aggressive / Scalping Mode (ADX OFF)
Best for:
* scalping
* intraday trading
* early entries
* quick pullbacks
Signals appear earlier because:
* no trend filter
* no ADX restriction
👉 Interpretation:
**Market is stretched and likely to react (not always fully reverse)**
---
Practical usage
Clean chart (recommended)
* Confirmed Signals = ON
* Warnings = OFF
* Exhaustion Markers = OFF
→ Only triangles → clean and focused
---
Full context mode
* Confirmed Signals = ON
* Warnings = ON
* Exhaustion Markers = ON
→ See full market condition
---
How to read the market
Strong trend
* many warning circles
* few confirmed signals
→ trend still healthy
---
Weakening trend
* orange diamonds appear
* warnings reduce
* then triangle appears
→ higher probability reversal
---
Works best in
* extended trends
* volatility expansions
* emotional market phases
---
Works worse in
* tight ranges
* low volatility chop
* slow grinding trends
---
Best used with
* support / resistance
* liquidity zones
* Keltner / Bollinger bands
* RSI divergence
* market structure breaks
* higher timeframe bias
---
Summary
This indicator answers one question:
> **Is the trend still strong — or starting to break?**
* Triangles → confirmed reversals
* Circles → early warnings
* Diamonds → momentum fading
With ADX:
→ cleaner, slower, more reliable
Without ADX:
→ faster, noisier, more aggressive
Final note
This is **not a trend-following indicator**.
It is designed for:
* exhaustion detection
* reversal timing
* identifying unstable price moves
Use it with context — not in isolation.

Wyłączenie odpowiedzialności
Informacje i publikacje nie stanowią i nie powinny być traktowane jako porady finansowe, inwestycyjne, tradingowe ani jakiekolwiek inne rekomendacje dostarczane lub zatwierdzone przez TradingView. Więcej informacji znajduje się w Warunkach użytkowania.
Wyłączenie odpowiedzialności
Informacje i publikacje nie stanowią i nie powinny być traktowane jako porady finansowe, inwestycyjne, tradingowe ani jakiekolwiek inne rekomendacje dostarczane lub zatwierdzone przez TradingView. Więcej informacji znajduje się w Warunkach użytkowania.