Triple EMA Candle Painter + Signals
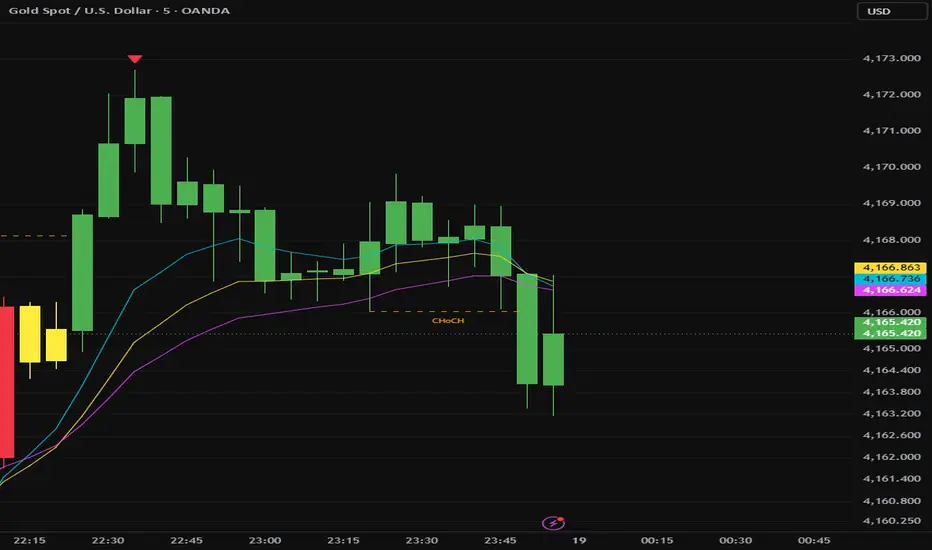
Candle painting
Green: the Fast EMA and the Mid EMA are both above the Slow EMA.
Red: the Fast EMA and the Mid EMA are both below the Slow EMA.
Grey: anything else, including when they are exactly equal.
Painting method: it recolours the chart’s own candles (body, border and wick), so it shows at all times, not only on hover.
Signals
BUY: it appears on the first candle where the state turns green, meaning the previous candle wasn’t green.
SELL: it appears on the first candle where the state turns red.
Timing: signals are only shown once the candle has closed, so a live candle won’t flash a signal and then remove it. The candle colour itself can still change while a candle is forming.
Warm-up: no signals appear until the chart has at least as many bars as your longest EMA.
Alerts: BUY and SELL alerts are included.
Settings
EMA lengths: Fast 21, Mid 34 and Slow 55, each adjustable, plus the price source.
Colours: you can change the three candle colours.
EMA lines: the lines can be shown or hidden and recoloured.
Signals: the BUY/SELL markers and the candle painting each have an on/off switch.
You can change the EMA values to 9,14,21 for fast scalping
Entry setup from the BUY and SELL signals
Levels: entry is the signal candle’s close. The SL is 1.5×ATR away, and TP1, TP2 and TP3 are at 1R, 2R and 3R. They are drawn as lines with price labels. ATR length, the multiplier, the R values and the line length (20 bars) can be changed under “Entry Setup (SL / TP)”.
SL hit: if a later candle trades through the SL, the Entry, SL and TP lines and labels are removed. The BUY or SELL marker is removed too, the same as in your structure script. If you want to keep the marker, turn off “Also Remove BUY / SELL Marker When SL Is Hit”.
Signals too close together: if a new signal comes fewer than 9 candles after the previous one, the previous signal’s marker and setup are deleted and the new one stays. The 9 is adjustable as “Min Candles Between Signals”.
Alerts: an alert that already fired for a deleted signal can’t be taken back, because deleting only changes the chart.
BUY and SELL markers: these are now labels so they can be deleted. They look the same as before.
Market structure
HH and LL: a Higher High gets a marker above its candle and a Lower Low gets one below it. Each has its own dropdown for the shape (Off, Triangle, Arrow and so on). The markers are red above and green below, sized to the candle width.
BOS and CHoCH: when a candle closes beyond the last swing high or low, a dashed line and a label are drawn. It’s BOS if the break continues the current structure and CHoCH if it flips it. BOS is blue and CHoCH is orange.
Swing length: it defaults to 5, so structure shows up a bit later but is cleaner than the faster setting in your other script. The BOS/CHoCH labels can be turned off.
Alerts: these are added for HH, LL, BOS and CHoCH.
Green: the Fast EMA and the Mid EMA are both above the Slow EMA.
Red: the Fast EMA and the Mid EMA are both below the Slow EMA.
Grey: anything else, including when they are exactly equal.
Painting method: it recolours the chart’s own candles (body, border and wick), so it shows at all times, not only on hover.
Signals
BUY: it appears on the first candle where the state turns green, meaning the previous candle wasn’t green.
SELL: it appears on the first candle where the state turns red.
Timing: signals are only shown once the candle has closed, so a live candle won’t flash a signal and then remove it. The candle colour itself can still change while a candle is forming.
Warm-up: no signals appear until the chart has at least as many bars as your longest EMA.
Alerts: BUY and SELL alerts are included.
Settings
EMA lengths: Fast 21, Mid 34 and Slow 55, each adjustable, plus the price source.
Colours: you can change the three candle colours.
EMA lines: the lines can be shown or hidden and recoloured.
Signals: the BUY/SELL markers and the candle painting each have an on/off switch.
You can change the EMA values to 9,14,21 for fast scalping
Entry setup from the BUY and SELL signals
Levels: entry is the signal candle’s close. The SL is 1.5×ATR away, and TP1, TP2 and TP3 are at 1R, 2R and 3R. They are drawn as lines with price labels. ATR length, the multiplier, the R values and the line length (20 bars) can be changed under “Entry Setup (SL / TP)”.
SL hit: if a later candle trades through the SL, the Entry, SL and TP lines and labels are removed. The BUY or SELL marker is removed too, the same as in your structure script. If you want to keep the marker, turn off “Also Remove BUY / SELL Marker When SL Is Hit”.
Signals too close together: if a new signal comes fewer than 9 candles after the previous one, the previous signal’s marker and setup are deleted and the new one stays. The 9 is adjustable as “Min Candles Between Signals”.
Alerts: an alert that already fired for a deleted signal can’t be taken back, because deleting only changes the chart.
BUY and SELL markers: these are now labels so they can be deleted. They look the same as before.
Market structure
HH and LL: a Higher High gets a marker above its candle and a Lower Low gets one below it. Each has its own dropdown for the shape (Off, Triangle, Arrow and so on). The markers are red above and green below, sized to the candle width.
BOS and CHoCH: when a candle closes beyond the last swing high or low, a dashed line and a label are drawn. It’s BOS if the break continues the current structure and CHoCH if it flips it. BOS is blue and CHoCH is orange.
Swing length: it defaults to 5, so structure shows up a bit later but is cleaner than the faster setting in your other script. The BOS/CHoCH labels can be turned off.
Alerts: these are added for HH, LL, BOS and CHoCH.

Wyłączenie odpowiedzialności
Informacje i publikacje nie stanowią i nie powinny być traktowane jako porady finansowe, inwestycyjne, tradingowe ani jakiekolwiek inne rekomendacje dostarczane lub zatwierdzone przez TradingView. Więcej informacji znajduje się w Warunkach użytkowania.
Wyłączenie odpowiedzialności
Informacje i publikacje nie stanowią i nie powinny być traktowane jako porady finansowe, inwestycyjne, tradingowe ani jakiekolwiek inne rekomendacje dostarczane lub zatwierdzone przez TradingView. Więcej informacji znajduje się w Warunkach użytkowania.